Serbia Justice Functional Review
External Performance Assessment > Efficiency in the Delivery of Justice Services
a. Production and Productivity of Courts
- This section reviews three basic indicators regularly employed to measure judicial efficiency: total dispositions, dispositions per judge, and clearance rates, corresponding to Indicator 1.1 of the Performance Framework. The section examines variations among types of courts, courts of the same type, and types of cases. Each indicator is explained in its respective subsection. Analysis is inhibited by the absence of a case-weighting methodology.179
i. Case Dispositions
- The absolute number of dispositions realized annually is a measure of production or of ‘system productivity’. This is not a usual comparative and cross-country indicator because, like caseloads, absolute numbers require context.180 Nonetheless, in a single country, tracking disposition numbers across time is useful for assessing performance, particularly for management purposes. Rising or falling numbers of dispositions, overall or by court type, can help guide redistribution of resources, signal problems requiring further exploration, or be used to assess the results of reform initiatives. For example, if more criminal investigations and trials are completed under Serbia’s new Criminal Procedures Code 2013 (CPC), the transfer of investigations to the prosecutors could be considered to have enhanced efficiency. If adding judges or setting production targets produces significantly more dispositions, the measures have had their intended impacts. Disposition numbers can also be used as budgetary targets and the basis for budgetary requests. The Netherlands uses this system. Dutch courts not meeting their disposition targets return all or a part of the extra funds.
- As shown in Table 3 below, total annual dispositions vary considerably across court types. As discussed in the Demand Chapter, incoming cases were either stable or declining in number over the period. Thus, an increasing number of dispositions would suggest that judges were able to address (or at least not increase) their backlog, as further elaborated below
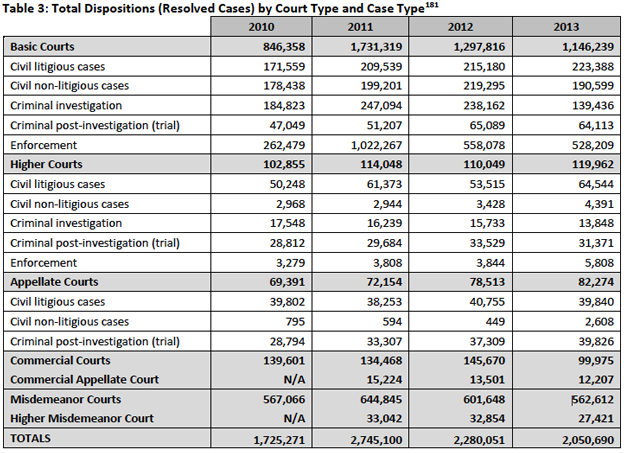
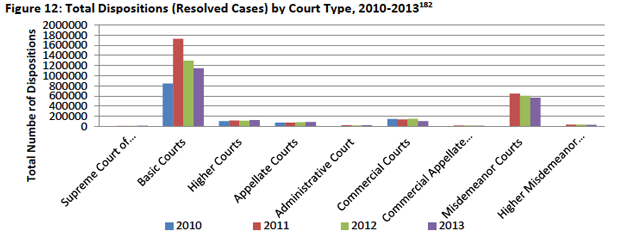
- The Basic Courts made a remarkable upward leap between 2010 and 2011, nearly doubling the number of dispositions, but fell back significantly in 2012 and 2013. There were positive trends in all cases except enforcement and criminal investigations, which were affected by legislative reforms and consequent declines in new filings. In these two areas, future disposition levels will only rise if more backlogged cases are resolved.
- The performance of Commercial Courts was less positive. Commercial Courts reached a peak in dispositions in 2012, but declined in 2013, likely due to a decrease in incoming cases. Despite lower caseloads in 2013, judges appear not to have turned their attention to backlog reduction, as they had in 2012.
- Misdemeanor Courts reduced dispositions between 2011 and 2013, again due to a fall in incoming cases. As discussed below, while all courts have a backlog they could attend to, output seems best explained by input. As courts receive fewer cases, most seem to cut back on their output correspondingly rather than compensating the difference with a concerted backlog reduction effort.
ii. Dispositions per Judge
- Judicial (as opposed to ‘system’) productivity is measured by calculating the ratio between the number of resolved cases and the number of professional judges within each court. A review of average dispositions per judge across the major types of courts (Figure 13) shows significant variations over time. The Basic and Commercial Courts have shown the largest and most significant drops, while the Appellate, Higher, and Misdemeanor Courts remained relatively stable.
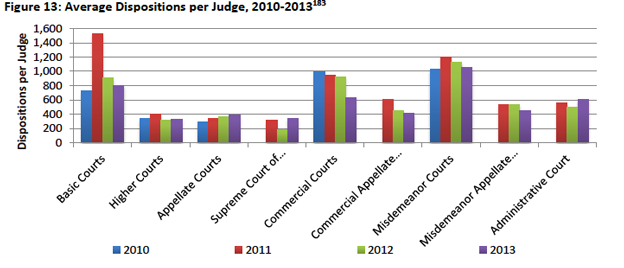
- After a remarkable rise in dispositions in 2011,184 dispositions per judge In Basic Courts dropped between 2012 and 2013. As detailed below, dispositions rates among individual courts showed considerable variation. However, the decrease in 2012 and 2013 were consistent across all Basic Courts as result of a combination of declining incoming cases and a lesser push to reduce backlogged cases.
- Dispositions per judge are far lower in the Higher and Appellate Courts. When asked, judges reported this is possibly due to their more complex work, and that they usually work in panels. However, judges in the Commercial Courts also deal with complex cases and sit in panels as commonly as the Higher and Appellate Courts do. Yet, despite a declining performance, Commercial Courts manage a disposition rate per judge that is almost double that of Higher and Appellate Courts. This may support the long-held view that specialization reaps a dividend in terms of the productivity of judges. Such a productivity dividend was emphasized to the Review team in interviews, and many stakeholders suggest that some form of specialization in the daily work of judges, prosecutors, and their staff, particularly in large jurisdictions, could lead to massive improvements in productivity and uniformity of decision-making.
- Dispositions per judge in the Higher Courts declined by 23 percent from 2011 to 2013.185 The appointment of new judges during that period resulted in higher total dispositions but lesser workload, (see Table 3 above). The Higher Courts also demonstrate considerable variation around the average, with several courts averaging as low as 154 dispositions per judge, while others averaged 450 dispositions per judge. As a result, some Higher Court judges have resolved over three times the workloads of other Higher Court judges in the same period.
- Appellate Courts managed a steady increase in disposition rates despite maintaining the same number of judges from 2011 to 2013. As shown further below, the Appellate Courts also improved other performance indicators over the period.
- Commercial Courts averaged 636 dispositions per judge in 2013. This is much lower than the 925 dispositions per judge in 2012 and preceding years.186 There is much variation across Commercial Courts. Belgrade has a huge impact on the Commercial Court average, receiving nearly half of all commercial incoming cases and delivering over one-third the dispositions. There are a few other Commercial Courts with consistently high disposition rates, but the remaining courts are typically well below the average for Commercial Courts. Still, the overall performance is higher than Higher or Appellate Courts.
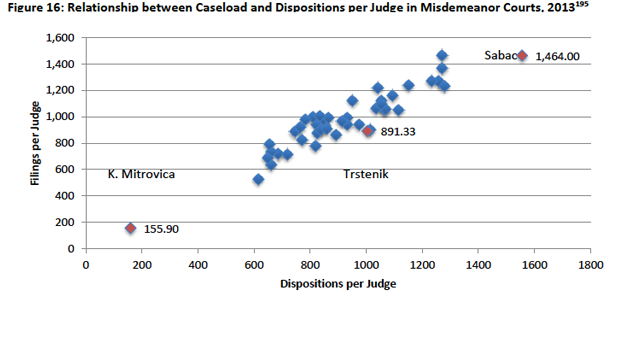
- Judges working in the Misdemeanor Courts produced an acceptable average 1,060 dispositions per judge in 2013, but there is much variation between Misdemeanor Courts. Disposition rates range from 156 dispositions per judge to 1,466 (in the Smederevo Misdemeanor Court). Still, misdemeanor cases are, by their nature, relatively quick to resolve. Thus, courts with disposition rates below the average, and in particular the 14 courts (out of 45) with fewer than 900 dispositions per judge, could be encouraged to do more. If all Misdemeanor Courts could average what Belgrade produces (1,365 dispositions per judge), only 412 Misdemeanor Judges would be needed full-time to manage the caseload. The remaining 100 or so judges could then contribute to other performance improvements, such as rotational training and managerial functions in courts. In contrast with the Basic Courts, there are only a few instances where the number of judges seems out of sync with demand.
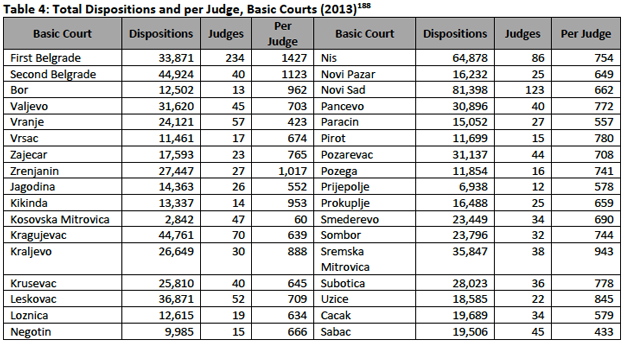
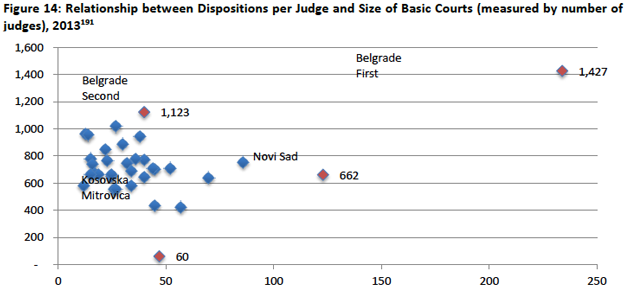
- In Basic Courts, the average of dispositions per judge was 806 in 2013, a decline from 959 in 2012.187 Table 4 shows average dispositions per judge in all Basic Courts. Dispositions per judge vary significantly across Basic Courts, ranging from 60 to 1,427 dispositions per judge.
- In Basic Courts, dispositions per judge do not correspond to court size. Medium size courts reach some of the highest disposition rates.189 The smallest courts (furthest to the left on the graph) are arranged nearly in a vertical line, from fewest to relatively high dispositions per judge. This suggests that some small courts are highly productive, while other small courts are not.190
- Despite the significant variations both in incoming cases per judge and dispositions per judge, there is a close relationship between the two variables (see Figure 15). The relationship suggests that judges tailor their output to their input to a large extent. Where the number of incoming cases is low, productivity is low as well, but when the workload increases, judges work more productively. This relationship has been found in other countries.192 Serbian judges appear to resolve slightly more than the number of cases they receive, but their productivity is closely linked to their incoming caseload.
- The close relationship may be due to prevailing productivity norms, which informally require judges to meet around 20 dispositions per month.193 Several judges report that they monitor their norms, with a focus on getting cases ‘out the door’, and once targets are reached they report feeling more comfortable to relax their pace of work. However, the theory does not explain why there are so many judges with low dispositions per judge.
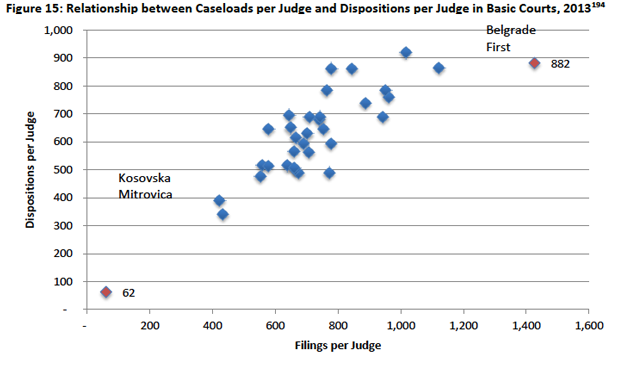
- The relationship between incoming cases and dispositions is even stronger for Misdemeanor, Higher, and Commercial Courts. Variations in disposition rates show no relationship to size of court, except that the largest court (always in Belgrade) has one of the highest disposition rates. The rates among other courts in each category are distributed nearly randomly when compared to court size. All are nonetheless strongly correlated with the number of incoming cases per judge.
- The above analysis highlights two conclusions; many courts are resolving fewer cases per judge than is reasonably feasible, and many judges have fewer cases than their colleague-judges. Dispositions per judge, and thus overall production (total dispositions), could be increased in each type of court if the low producers rose to meet the average disposition rate. Second, higher judicial productivity could further reduce backlogs, especially in the Basic, Commercial, and Misdemeanor Courts where it equals or exceeds the number of annual incoming cases. Third, if all courts produced at the current average level or above, fewer judges and fewer court staff would be needed for case processing.
- Judicial productivity could be significantly improved by setting higher targets – and monitoring them closely – while ensuring a more equitable distribution of incoming cases.196
- Further, if the output of lower performing courts could be lifted to the average, judges across Serbia would have considerably more time to contribute to other important functions that support the attainment of European standards. These could include more robust court management, participation in taskforces or working groups, knowledge-exchange and collegiums, mentoring of inexperienced judges, and continuous training at the Judicial Academy.197
iii. Clearance Rates
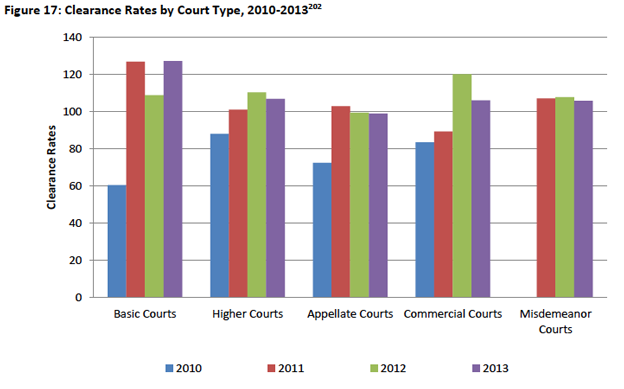
- While disposition levels are important indicators of productivity, they do not indicate whether courts are keeping with their workloads: the clearance rate is needed for this.198 Clearance rates for all court types have improved since 2010,199 and are now consistently over 100%.
- Increases in clearance rates have been largely due to falls in incoming cases, rather than improved performance. The sharp drop in incoming cases helped the courts (particularly the Basic, Commercial and Misdemeanor Courts) to resolve fewer cases without lowering their clearance rates.
- The data demonstrate that clearance rates should have been much higher, and in future there is capacity within the courts to do much better. With significantly fewer incoming cases in 2011 to 2013, clearance rates could have been higher, as judges resolved their incoming cases and attended to the backlog. Rather, clearance rates have been merely sustained or fallen slightly in 2013. Manpower is also a factor here. The fact that the court system maintained clearance rates of over 100% across most court types and case types in the absence of over 800 judges and prosecutors through 2011 and 2012 is telling.200 One would expect that following the return of over 600 judges by 2013201 that clearance rates would have boosted to reflect their return to work, but clearance rates changed only marginally. Looking towards 2014 and beyond, there is clearly capacity within the system to increase these clearance rates and thus reduce the backlog.
- The average clearance rates by court type obscure the significant variation among individual courts. This is best illustrated by the Basic Courts (Figure 18).
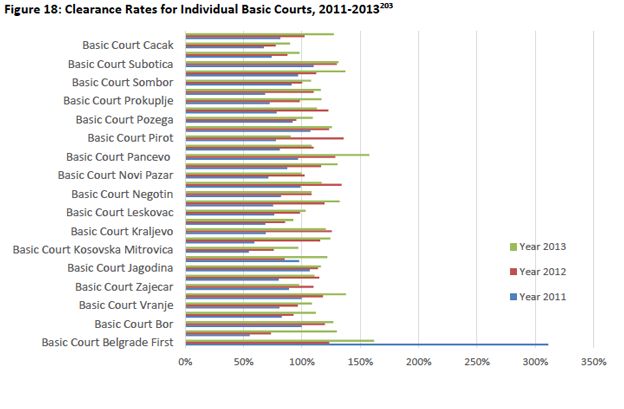
- Basic Court clearance rates have improved significantly since 2010.
Although some of the highest rates were achieved in 2011 or 2012, there are still many courts with rates well over 100 in 2013. For both 2011 and 2013, the system-wide clearance rate for Basic Courts was 127 percent, with a drop to 109 percent in 2012. However, in 2011, Belgrade First Basic Court raised the entire average, compensating for many courts that remained below 100. In 2012, more courts improved their rates, and Belgrade First dropped to sixth place. By 2013, only a few courts reported clearance rates below 100 percent, including Cacak, Krusevac and Pirot.
- For the Higher Courts, the overall clearance rate rose steadily from 88 to 107 percent. Belgrade and Novi Sad, with over half the dispositions between them, largely raised the average score for 2013, with rates of 120 and 124 respectively. Unfortunately, the least busy Higher Courts remained below 100: with lower workloads, judges in those courts could have at least resolved as many cases as they received.
- The Appellate Courts produced an overall clearance rate of around 100. The clearance rate could have been higher in 2013, except that the Appellate Court in Belgrade, which represents around one-third of all incoming cases and dispositions, brought down the average with its 95 percent score. However, the variation around the mean was relatively slight.
- The Commercial Courts’ improvements were due to the steady decline in incoming cases and the addition of 16 judges in 2012. However, despite an especially large drop in incoming cases in 2013, the higher clearance rate was not maintained for that year. Belgrade, with one half to one third the dispositions and incoming cases, played a critical but not always positive role. Although very few courts scored under 100 in either of the last two years, with falling workloads, higher rates and thus a reduction of backlog should have been entirely feasible.
- The average clearance rates for the Misdemeanor Courts remained fairly stable, dropping only by a point in 2013. While the clearance rates in many courts slipped in 2013,204 most individual courts were within 10 points on either side of the annual average, and a few reached 120 at least once.
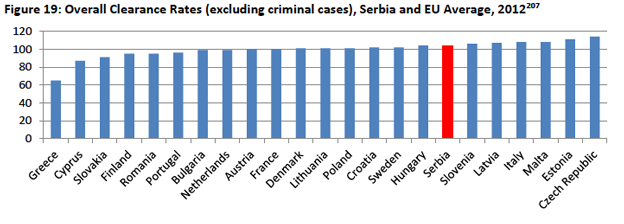
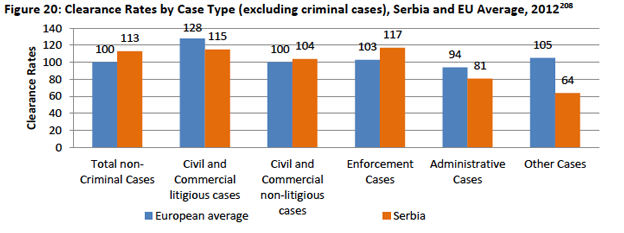
- Serbia’s clearance rates are broadly consistent with EU averages, but with significant variations.205 This is an improvement on previous performance. Still, as Serbia has nearly twice the European average for judges per 100,000 inhabitants, and a declining number of incoming cases, it would be surprising had it not done so.206