Public Prosecutors’ Offices
Efficiency,
Timeliness, and Productivity of Prosecutors’ Offices
- Serbia’s system of prosecution has undergone substantial
change since an adversarial system was introduced in 2013, but
performance measurement for Serbia’s prosecutors is too basic to
evaluate the impact of these reforms or the overall performance
of prosecutors’ offices. Prosecutors still lack support on using
performance measurement data to improve case management, develop
successful funding requests, foster public support, and respond to
criticism.
- Available data for prosecutorial services still was far
less extensive than it was for courts, and the data that was reported
was of limited use because of the collection methods and
formats. There was no unified electronic case management system
for the prosecutorial system in place by the end of 2019. Thus, the
preparation of those reports depended highly on manual data collection
and individual interpretation, which made the reports prone to
inconsistencies and inaccuracies.
- Serbian PPOs generally processed cases in a more timely
manner in 2018 and 2019 compared to previous years due to an increase of
nearly 25percent between 2016 and 2019 in the number of public
prosecutors working on cases. As a result, caseloads per
prosecutor decreased by 25 percent in Basic PPOs, by 33 percent in
Higher PPOs, and by 18 percent in Appellate PPOs.
- In 2017, the total number of PPO cases carried forward
from one year to the next also started decreasing after three years of
consistent increases. Cases carried forward from one year to
the next are characterized as backlogs. Appellate PPOs had very few
carried-forward cases. The number of carried-over cases in Basic PPOs
grew until 2016-2017, then declined. However, the number of
carried-forward cases in Higher PPOs grew every year between 2014 and
2019.
- Related to backlogs, clearance rates consistently
increased from 2014 through 2019.
The improvement in clearance rates for Basic PPOs was notable. The
average clearance rates for Higher PPOs were over 90 percent, but there
was an increasing trend of backlogs. The four Appellate PPOs each had
clearance rates of 100 percent over the six years from 2014 through
2019.
- Clearance rates do not indicate whether the oldest and/or
most complicated cases were concluded within reasonable
timeframes. The pressure to resolve more cases as quickly as
possible may mean that older and more difficult cases continue to age.
This result undercuts public confidence in prosecutors and the judicial
system overall, especially considering the impending statute of
limitations expiration.
- There is still no concrete data on the age structure of
pending cases. Also, the
information on aging cases would be very different if ‘unknown
perpetrators cases,’ also known as KTN cases, were included.
- There is room for improvement in the congestion ratio, a
measure of delay that addresses the ratio of resolved to unresolved
cases at the end of a year. Although they were improving, Basic
PPOs continued to have the highest congestion ratios among the three PPO
categories, with results two to six times higher than those of Higher
PPOs. There was no congestion in Appellate PPOs.
- Time to disposition is not tracked by Serbian
PPOs. Estimates suggest that disposition times vary greatly,
from less than a month to more than a year, depending on the level and
location of PPOs. Disposition times are longer in Basic PPOs, but some
Higher PPOs need improvement as well.
- Across all PPO types, average dispositions per prosecutor
were very similar to the trends for caseloads per prosecutor.
From 2014 to 2019, there was an increase of 10 percent for average
dispositions per prosecutor in Basic PPOs, and decreases in Higher and
Appellate PPOs by 29 and 17 percent, respectively.
- Because the responsibility for investigation has been
transferred from courts to PPOs, there is a concern among prosecutors as
to whether they have sufficient resources to process cases
efficiently. The increase in prosecutors’ responsibilities must
be followed by adequate resource allocation, which was not the case in
Serbia.
- There are significant and unexplained differences in the
performance of different PPOs at the same level. Appellate
PPOs, overall, are the most efficient of the three levels of PPOs. This
suggest that, on average, their resources are matched appropriately with
the demands for their services. Others specialized PPOs and specialized
departments in Serbia faced performance issues.
Introduction ↩︎
- Caseload numbers for Serbian PPOs generally were higher
than caseload numbers for the corresponding courts since PPOs identify
their cases by individual perpetrators
while courts, as a rule, identified their cases by the event,
which forms the basis of the charges and which could have involved many
defendants. The FR 2014 identified efficiency in the delivery
of prosecution services as a concern, but a lack of data inhibited more
detailed analysis. Despite the shortcomings in data availability that
still exist, enhanced data availability in this FR provides much more
insight to prosecution services than it was possible in FR 2014.
- Due to the lack of more extensive data that covers all of
2014 to 2019, this report has focused on criminal complaints (adult,
juvenile, and legal persons) and commercial
offenses. Criminal complaints against
unknown perpetrators are shown separately due to a substantial pending
stock accumulated over the years that would distort the overall figures.
Other specific case types are also analyzed separately and excluded from
the totals.
- Appellate PPOs data for 2014 to 2019 were collected
specifically for this report from the PPOs via the RRPO and the
SPC. The data includes the following case types or case stages:
second- and third-instance criminal complaints, “various criminal
cases”, complaints by injured persons, indictments, “corruption criminal
offenses” and other cases.
- Due to the nature of their caseloads, the work of
specialized PPOs has been analyzed separately in this FR.
Although the Special Prosecutor’s Office for War Crimes and the Special
Prosecutor’s Office for Organized Crime handle relatively few cases
compared to other Higher PPOs, their cases generally are complex and
generate significant public interest. The higher caseloads of the
specialized department for high-tech crime and the specialized
departments to combat corruption also are examined separately.
Caseloads and Workloads ↩︎
Overall Demand for
Prosecutors’ Services ↩︎
- As was true for the earlier FRs, overall demand for
prosecutorial services is assessed through caseloads and workloads,
with ‘caseload’ defined as the number of incoming cases
for a given year and ‘workload’ as the sum of the number of incoming and
pending cases for a given year.
- According to the CEPEJ 2020 report, based on 2018 data,
the incoming caseloads of prosecutors in Serbia were significantly
higher than in the EU27, the EU11 Member States, and the Western
Balkans. Serbian prosecutors in 2018
received 5.70 cases per 100 inhabitants, while the average of EU27 was
3.48. The EU11 Member States and Serbia’s Western Balkans peers reported
2.06 and 2.43 received cases per 100 inhabitants, respectively. See Figure 55 below.
Figure 55: Number of Cases Received by Public Prosecutors per 100
Inhabitants
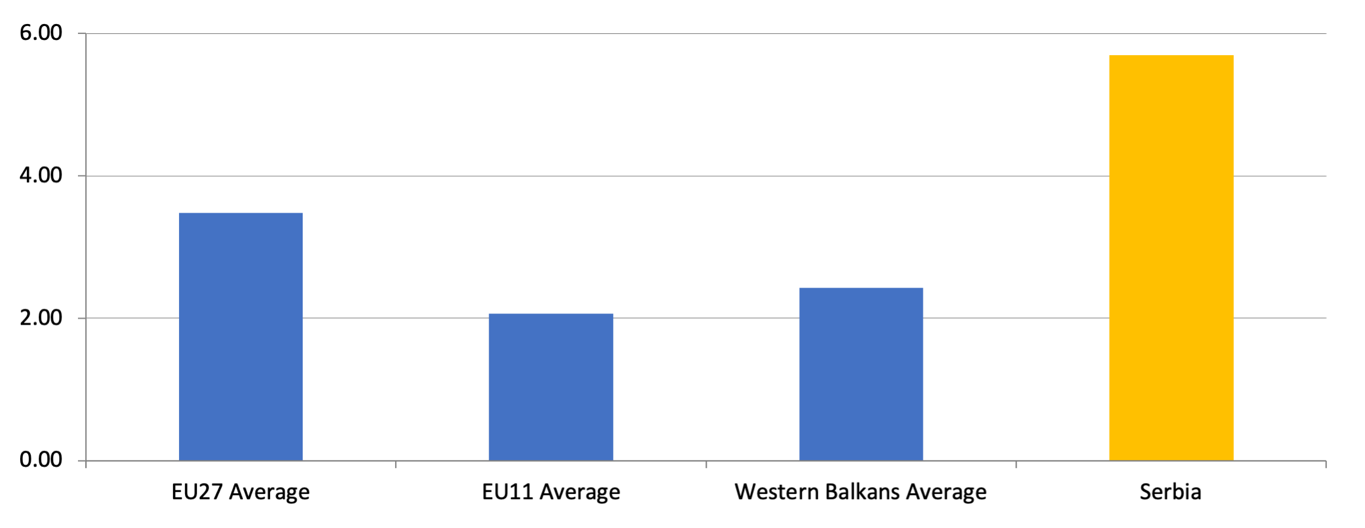
Source: CEPEJ 2020 report (2018 data)
- The incoming caseloads of prosecutors in 2018, as
calculated by CEPEJ, increased by three and a half times compared to
2016, primarily due to the changes in the reporting methodology, i.e.,
the addition of case types to Serbia’s reported numbers.
Previously, the number of received cases per 100 inhabitants had been
decreasing; in 2014, it decreased from 3.15 to 2.77 and 1.61 in 2016. As
described earlier in this analysis, unknown perpetrators and various
other case types were introduced to cases reported to CEPEJ in Serbia’s
data for 2018. It also is not clear from the CEPEJ report what type of
cases may be included in the statistics provided from every country –
for instance, Croatia does not include unknown perpetrators in the
reported number of cases handled by its prosecutors. Serbia’s high
figures also caused the Western Balkans average based on 2018 to rise,
i.e., without Serbia’s numbers, the Western Balkans average would have
been 1.61 cases received by public prosecutors per 100
inhabitants.
Caseloads of PPOs ↩︎
- PPOs in the country’s large urban areas did not always
have the largest relative caseloads, and there also was no concentration
of incoming cases in any particular region or for PPOs of any particular
size. These conclusions are presented in Figure 56, below. For
instance, in 2014, the small Basic PPO in Senta had the highest relative
caseload, with 4.47 incoming cases per 100 inhabitants, while In 2015,
the highest caseload of 2.51 cases per 100 inhabitants was recorded in
the medium-sized Basic PPO in Vranje.
Serbia’s largest Basic PPO, the First Basic PPO in Belgrade, came in only sixth with 2.20
incoming cases per 100 inhabitants in 2014 and fifth with 2.21 in 2015,
but it held first place in terms of incoming cases per 100 inhabitants
from 2016 through 2019. Conversely, in 2019 the Second and Third Basic
PPOs in Belgrade, each with an area of roughly 500,000 inhabitants,
recorded only 2.12 and 2.33 incoming cases per 100 inhabitants,
respectively. The Basic PPO in Novi Sad, Serbia’s second-largest city,
was 19th in 2019, with 1.34 received cases per 100
inhabitants.
Figure 56: Incoming Caseloads of Prosecutors per 100 Inhabitants in
Basic PPOs in 2019
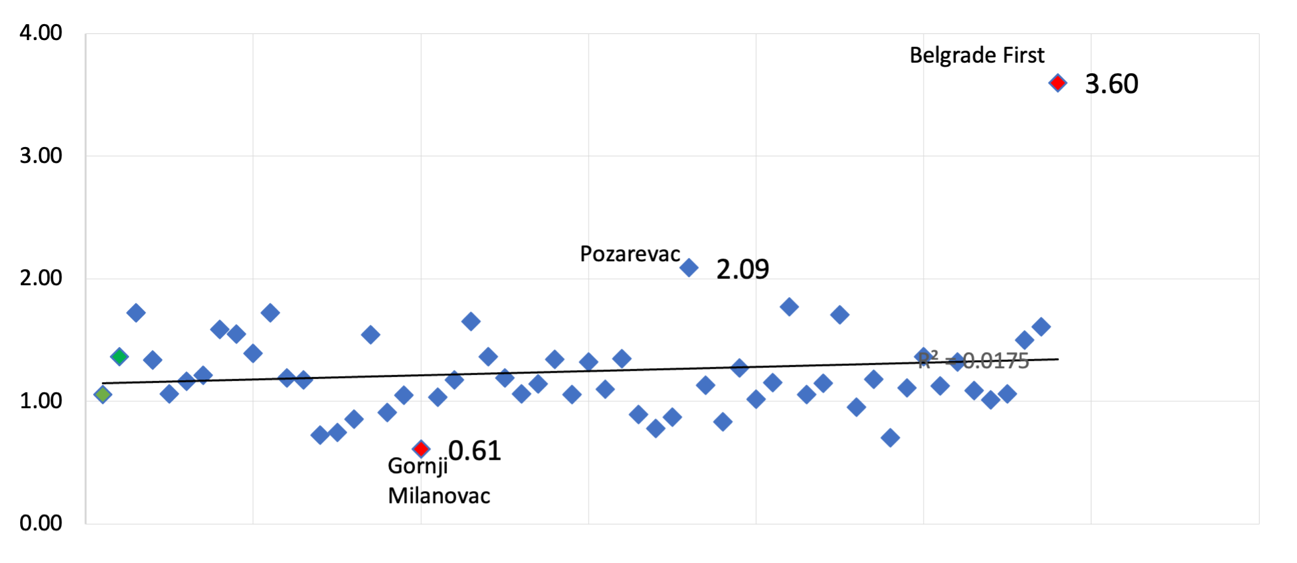
Source: RPPO Annual Report 2019 and Population Census
2011
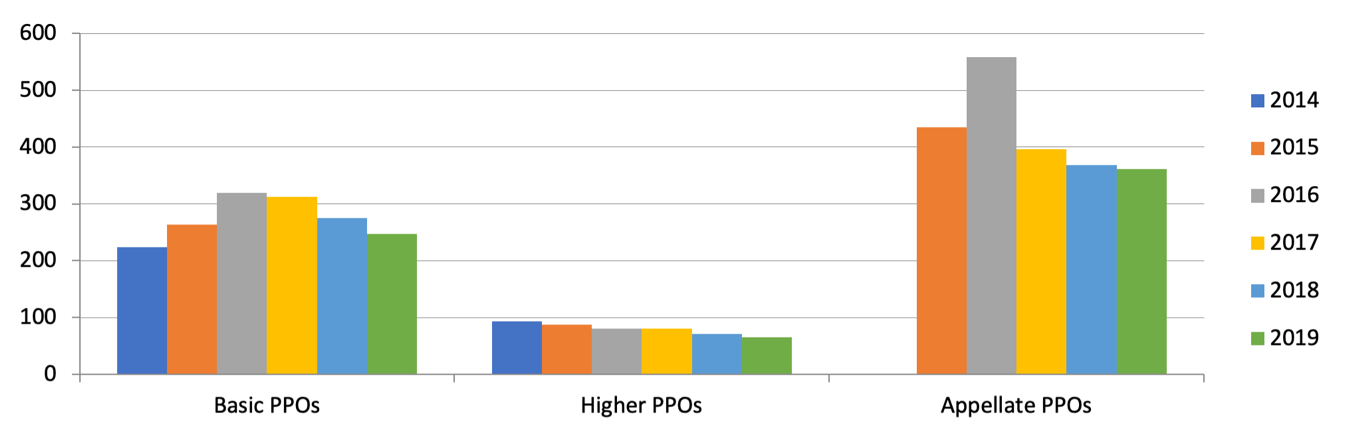
- In 2019, Basic, Higher, and Appellate PPOs received
130,938 new cases, which represented a seven percent increase in the
caseload from 2014. Seventy-seven percent of the 2019 total, or
101,312 cases, were received by Basic PPOs. This compared to 76 percent
in 2014. Higher PPOs received one-tenth or 13,316 cases in 2019,
compared to 11 percent in 2014. Just over one-tenth of the total, or
16,310 cases, were received by the Appellate PPOs, compared to 14
percent in 2014. See Figure 57.
Figure 57: Received Cases in Basic, Higher and Appellate PPOs from
2014 to 2019
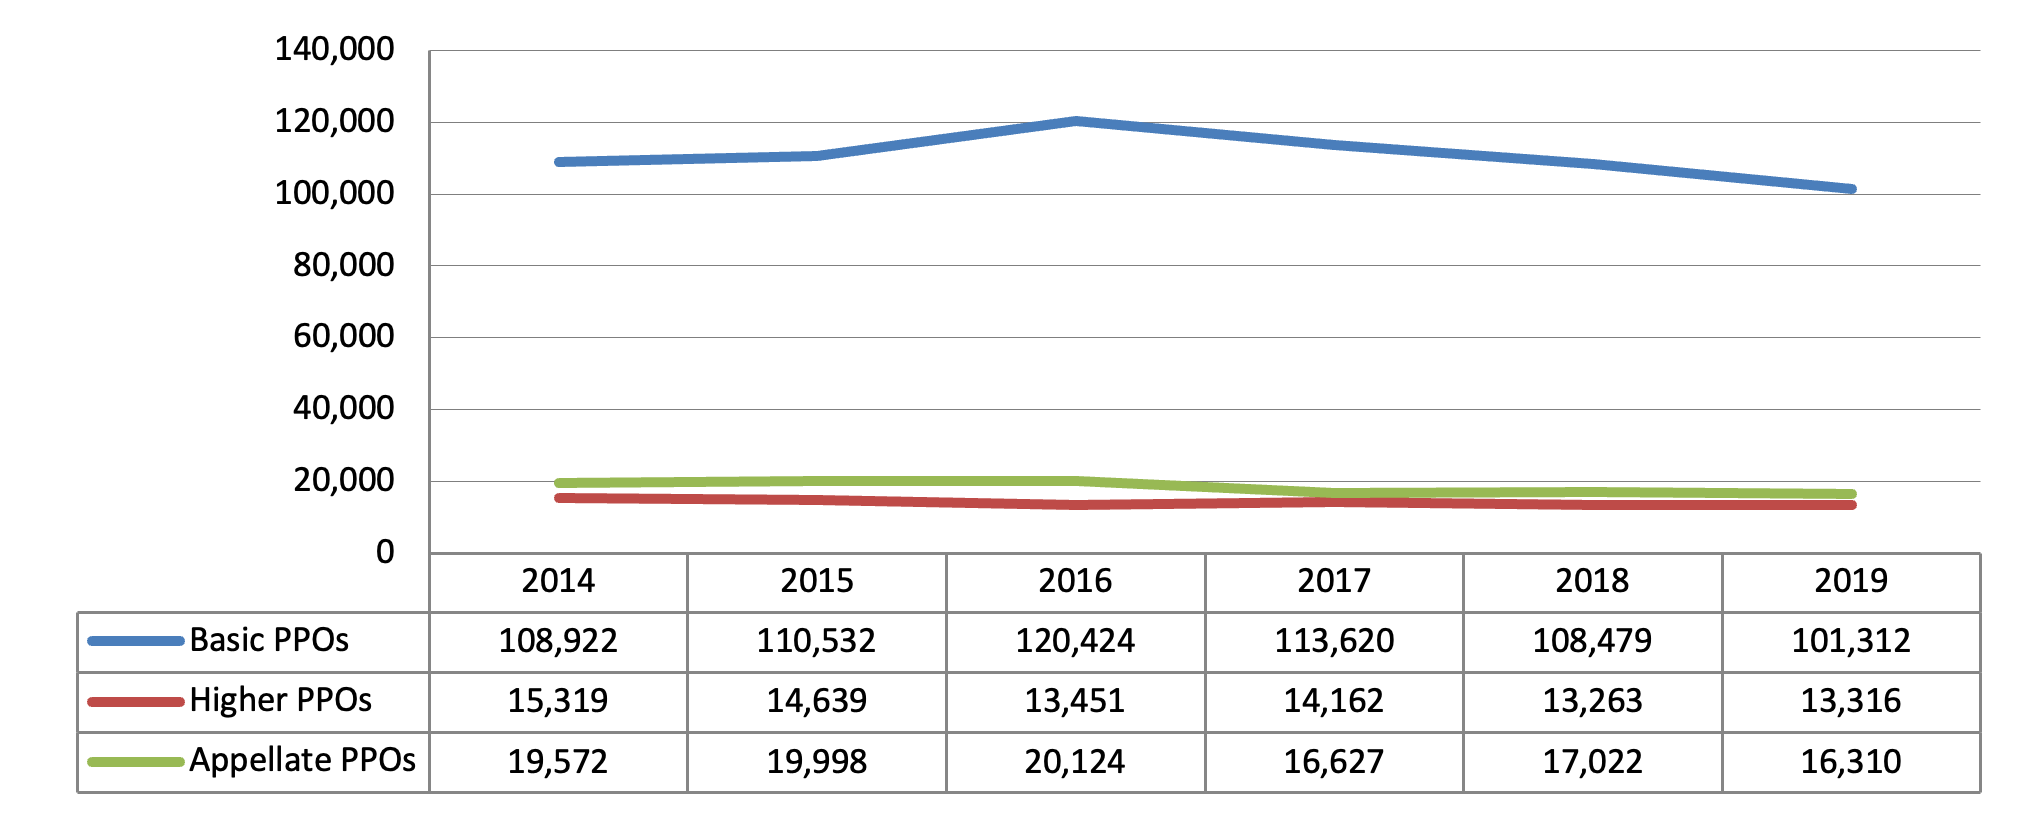
Source: RPPO Annual Reports 2014 – 2019 and Appellate PPOs
Data
- The seven percent increase for all PPOs from 2014 to 2016
was driven by the increased caseload received by Basic PPOs, which grew
by 11 percent or 11,502 cases. In contrast, the caseloads of
Higher PPOs decreased by 1,868 or 12 percent during the same period. The
largest share of the cases received in 2016 were those involving adult
and juvenile criminal cases in Basic and Higher PPOs (68 percent of the
153,999 cases), followed by commercial offenses (14 percent), and the
0.13 percent involving legal persons
cases. Thirteen percent of the total incoming caseload was handled by
the Appellate PPOs, which was an increase of three percent from 2014.
From 2016 to 2019, the incoming caseload remained stable in Higher PPOs,
while a decrease of 16 percent and 19 percent was witnessed in the Basic
and Appellate PPOs, respectively. In 2020, Basic PPOs received 88,744
cases or 12 percent fewer cases than in 2019. Higher PPOs received
11,128 cases, a decline of 16 percent over the previous year. Both were
caused by declines in the most significant case types: criminal cases
and commercial offenses in Basic PPOs and criminal cases and juvenile
cases in Higher PPOs. Legal persons cases continued to occupy a
negligible portion of the PPOs caseloads in 2020.
- The largest share of the incoming caseload in the Basic
PPOs in 2019 were criminal complaints, 88,489 thousand or 83
percent. Commercial offenses represented 16 percent of these
and the legal persons were 0,19 percent, as shown by Figure 58.
Figure 58: Received Cases in Basic PPOs by Case Type in 2019
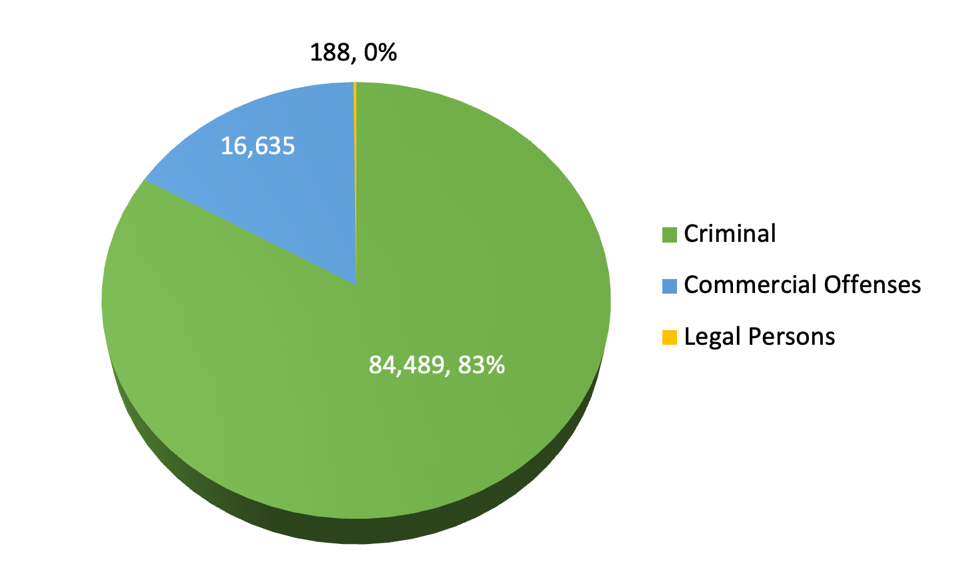
Source: RPPO Annual Report 2019
Box 17: The continuing problems posed
by the “various criminal cases,” included in the KTR registry
- Available data did not explain the most significant
caseload variations for individual Basic PPOs, and there was no analysis
by the RRPO or the SPC made available to the FR team of the reasons for
these differences. In general, the overall
number of received cases increased each year for until 2016 and then
stabilized, but there were exceptions. For example, the most significant
yearly variation – an increase of 206 percent – was reported for the
Basic PPO in Obrenovac in 2015 due to a jump in the number of criminal
complaints. More specifically, that Basic PPO received 574 criminal
complaints in 2014, 1,757 in 2015, 1,182 in 2016, 796 in 2017, 646 in
2018 and 798 in 2019.
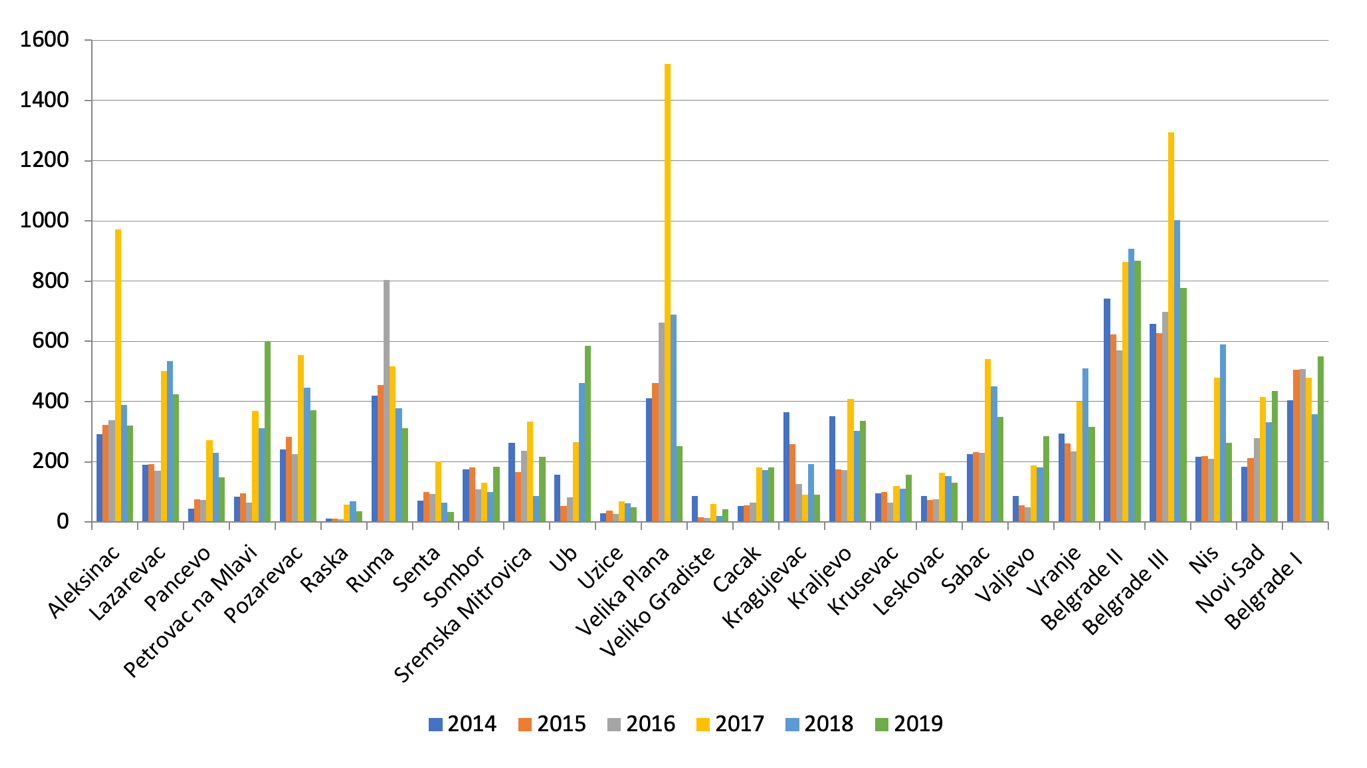
- The caseloads for Higher PPOs declined by 13 percent
overall from 2014 to 2019, but the FR team also was not privy to any
official analysis of the reasons for this phenomenon. In
absolute numbers, 14 Higher PPOs saw an increase in their caseloads by a
total of 354 cases, while the remaining 11 Higher PPO caseloads
decreased by a total of 2,152 cases. As shown in Figure 59 below, 14 of
25 Higher PPOs received more cases in 2019 than in 2018. The highest
increases were recorded in the Higher PPOs in Jagodina, Novi Pazar,
Cacak, and Leskovac, by 41, 39, 29, and 18 percent, respectively.
Conversely, the most significant decreases were more modest, by 16
percent in Kraljevo, 15 percent in Novi Sad, 13 percent in Nis, and 12
percent in Sombor.
Figure 59: Received Cases in Higher PPOs from 2014 to 2019

Source: RPPO Annual Reports 2014 – 2019
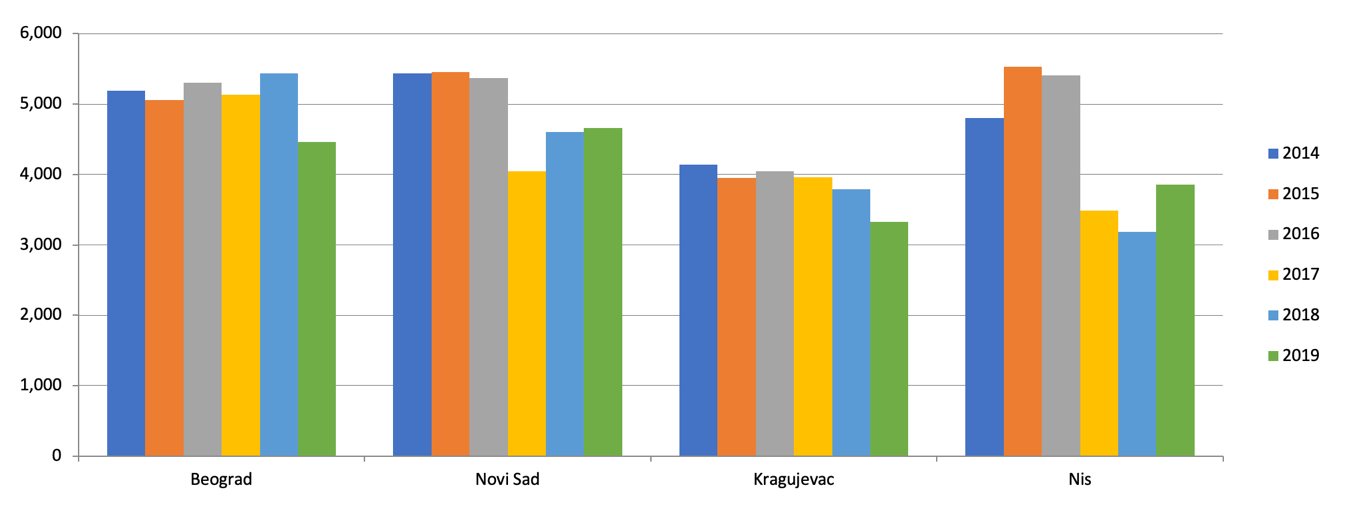
- From 2014 to 2019, the total appellate caseload fell by
17 percent and included most case types, but data did not reveal any
specific reason(s) for this drop. The marked decline began in
2017 when all Appellate PPOs received fewer cases, but the most
significant changes were recorded by the Appellate PPOs in Nis (with a
35 percent decline and 1,920 few cases) and Novi Sad (25 percent and
1,318 cases). By 2019, the Appellate PPOs in Belgrade and Kragujevac had
joined the trend; Belgrade had 18 percent fewer cases than it had in
2018, and Kragujevac had 12 percent fewer. In Novi Sad, the incoming
caseload remained stable from 2018 to 2019, while in Nis, it grew by 21
percent. See Figure 60 below.
Figure 60: Received Cases in Appellate PPOs from 2014 to 2019
Source: Appellate PPOs Data
Box 18: Second and Third Instance Prosecution Cases
Prosecutors’ Services by Case
Type ↩︎
- In Higher PPOs, from 2014 to 2019, caseloads of criminal
cases against adult defendants decreased by 30 percent while the
criminal, and juvenile cases increased by three percent. There
was an increase from seven to 18 received cases for the category of
legal persons during the same period. In 2020, Higher PPOs received ten
percent fewer criminal cases and 21 percent fewer juvenile cases than in
the previous year, as shown in Figure 61 below. There were 43 newly
received legal persons cases in 2020, exclusively due to Higher PPO in
Belgrade incoming stock.
Figure 61: Received Cases in Higher PPOs by Case Type from 2014 to
2020
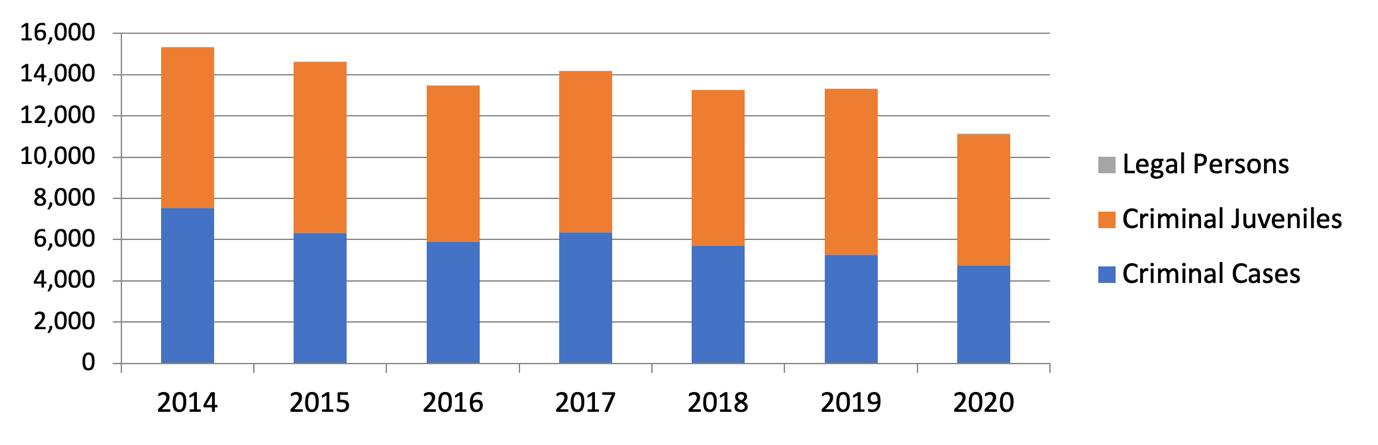
Source: RPPO Annual Reports 2014 – 2020
- A 10-fold increase in the caseloads for commercial
offenses from 2015 to 2016 was triggered by the implementation of the
new Accounting Act and caused a
bottleneck in PPOs that lasted through 2019. The Accounting Act
was passed and took effect before prosecutors could develop procedures
to handle these cases or seek the additional resources they needed to
handle them. The number of received commercial offense cases jumped from
1,732 in 2015 to 21,178 in 2016 and still stood at 23,321 in 2017,
19,900 in 2018, and 16,635 cases and 2019. A new Accounting Act entered into force on 1 January
2020 but it did not contain any significant changes related to
commercial offenses.
Workloads of PPOs ↩︎
- The total workloads of Basic, Higher, and Appellate PPOs,
defined as the sum of received and cases carried over from previous
years, increased by a total of 12 percent from 2014 to 2019, as shown in
Figure 62. The workloads increased each year from 2014 to 2016
and then decreased gradually from 2017 to 2019, ending at a total of
246,182 cases.
Figure 62: Basic, Higher and Appellate PPOs Workload from 2014 to
2019
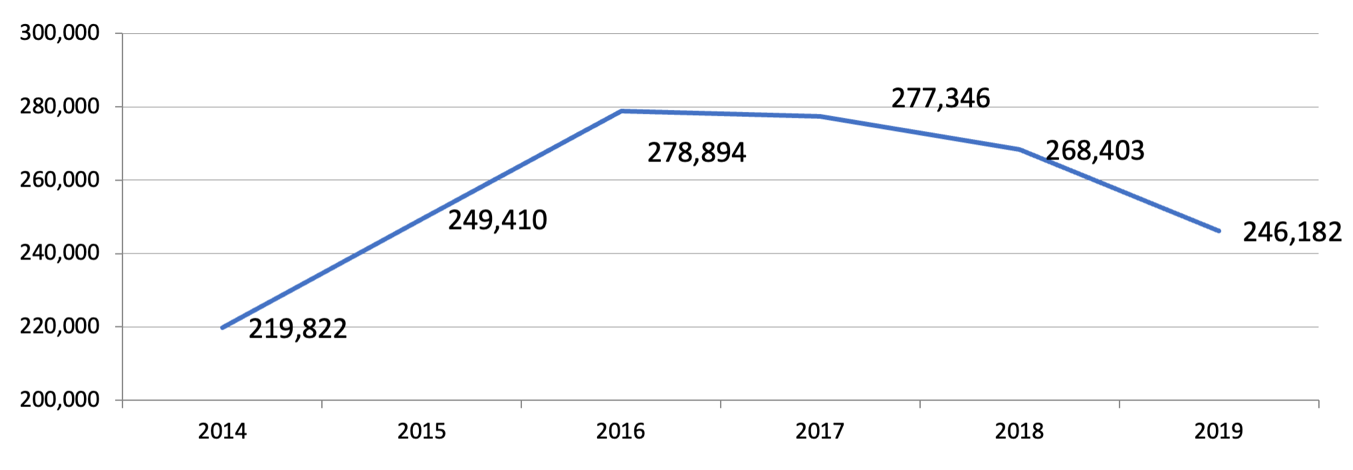
Source: RPPO Annual Reports 2014 – 2019 and Appellate PPOs
data
- The greatest workload increase occurred in Basic PPOs
from 2014 to 2017, a period which saw a 33 percent increase of
approximately 60,000 cases. The described increase was
connected to the new CPC and the transfer of investigation cases from
courts to PPOs. However, Basic PPO workloads decreased by four percent
in 2018 and nine percent in 2019. In 2020, Basic PPO workloads continued
to decrease, by ten percent. See Figure 63.
Figure 63: Basic PPOs Workload from 2014 to 2020
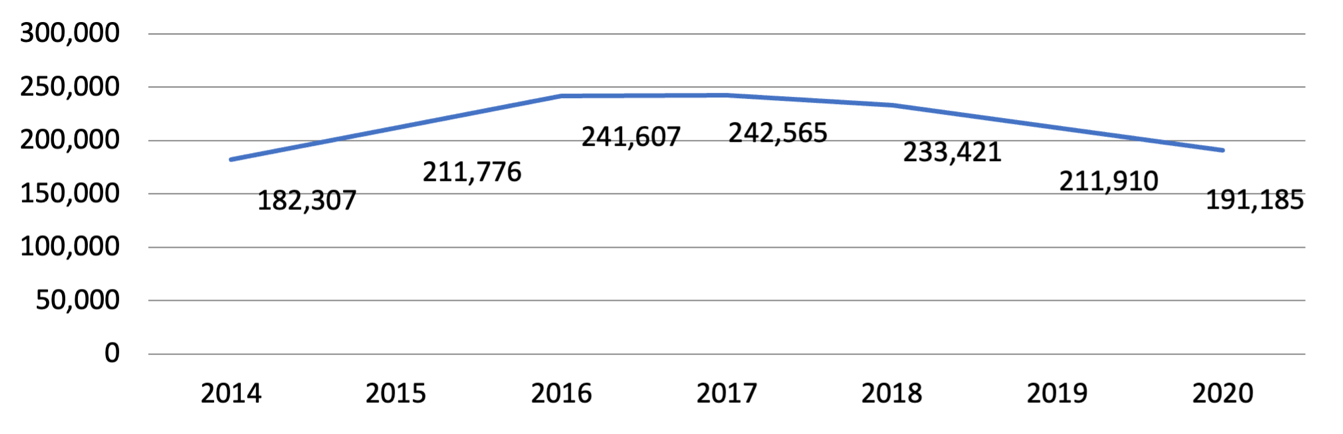
Source: RPPO Annual Reports 2014 – 2020
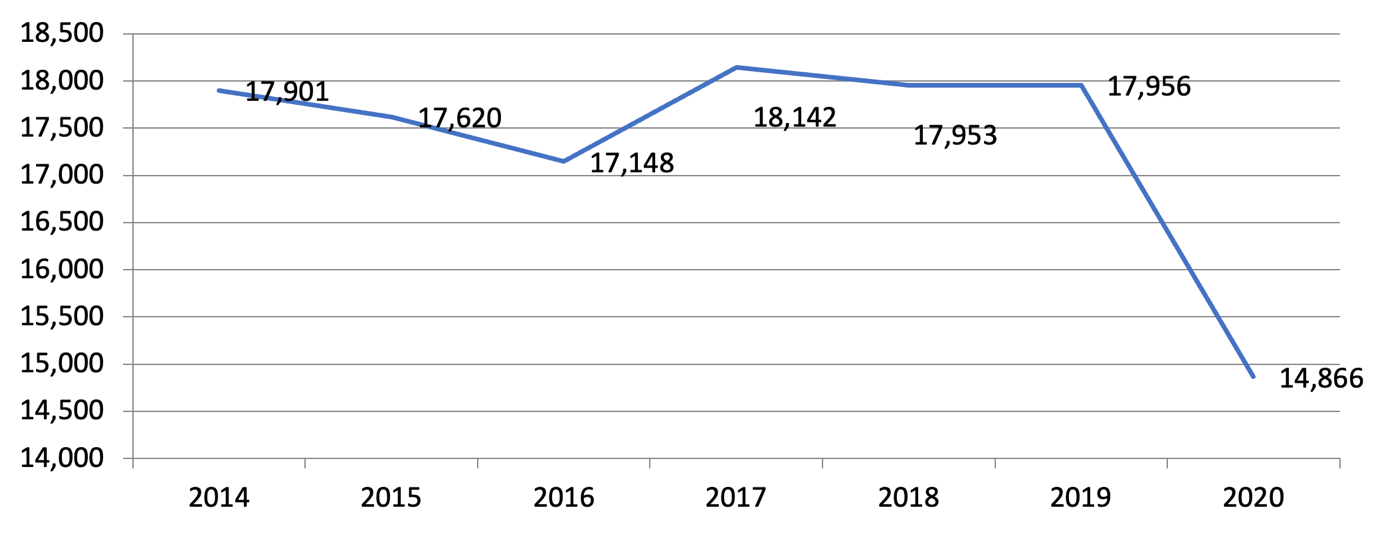
- Higher PPOs workloads were relatively stable from 2014 to
2019, ranging between 17,000 and 18,000 cases. Since the
clearance rates of Higher PPOs were between 93 and 96 percent (except
for 2018, when 100 percent was reported), the fall in the workloads in
2015 and 2016, as illustrated in Figure 64, were caused exclusively by
the lower numbers of incoming cases. With 14,866 cases in 2020, Higher
PPOs workloads decreased by 17 percent.
Figure 64: Higher PPOs Workload from 2014 to 2020
Source: RPPO Annual Reports 2014 – 2020
- The workloads of Appellate PPOs followed the same trends
as their caseloads, growing by three percent from 2014 to 2016 and then
dropping by 19 percent from 2016 to 2019
Efficacy and Efficiency ↩︎
Case Dispositions ↩︎
- Improved disposition rates from 2014 to 2019 were the
result of increased prosecutorial productivity overall, combined with
the continuously rising numbers of operatively active prosecutors.
Cases were disposed of by traditional dismissals, deferred prosecutions,
or indictment and trial. While the absolute number of dispositions in a
year is a measure of system productivity, a comparison of increasing and
decreasing dispositions overall by PPO, or PPO type, can contribute to
decisions about the distribution of resources and determine the impact
of reforms. The comparisons also can help identify problems or
bottlenecks within the system.
- Overall dispositions tended to track the incoming
caseloads and the workloads, i.e., increase and decrease
correspondingly. From 2014 to 2019, the number of cases
disposed of by all PPOs increased by 21 percent, including an increase
by 36 percent in Basic PPOs and decreases by 14 percent in Higher PPOs
and 17 percent in the Appellate PPOs. In Higher PPOs, the numbers of
dispositions almost always were slightly below the number of incoming
cases. In Appellate PPOs, however, the reduction was directly caused by
a fall in their workloads, and the Appellate PPOs resolved as many cases
as they received. See Figure 65. In 2020, both Basic and Higher PPOs
reported lower dispositions, by eight percent and 11 percent,
respectively.
Figure 65:Disposed Cases in Basic, Higher and Appellate PPOs from
2014 to 2019

Source: RPPO Annual Reports 2014 – 2019 and Appellate PPOs
Data
Clearance Rates ↩︎
- Average total clearance rates of Serbian PPOs
consistently increased from 2014 through 2019, finally exceeding 100
percent in 2018 and 2019. Clearance rates are expressed as a
percentage, obtained by dividing the number of resolved cases with the
number of incoming cases. A clearance rate of more than 100 percent
demonstrates that the PPO resolved more cases than it received. If the
clearance rate was lower than 100 percent, the PPO disposed of fewer
cases than it received, causing the total number of cases to
increase.
- As prosecutors became more experienced in working with
the CPC that took effect in 2013, clearance rates grew consistently from
79 percent in 2014, to 86 percent in 2015, 94 percent in 2016, 99
percent in 2017, and finally to 107 percent in 2018 and 105 percent in
2019. Presumably, the increase in the number of operatively
active prosecutors in 2018 and 2019 contributed to the results for those
years, together with improved skills in the effective application of the
CPC acquired through training and consultations and the increased use of
deferred prosecution and plea bargaining.
Figure 66: Clearance Rates by PPO Type from 2014 to 2019
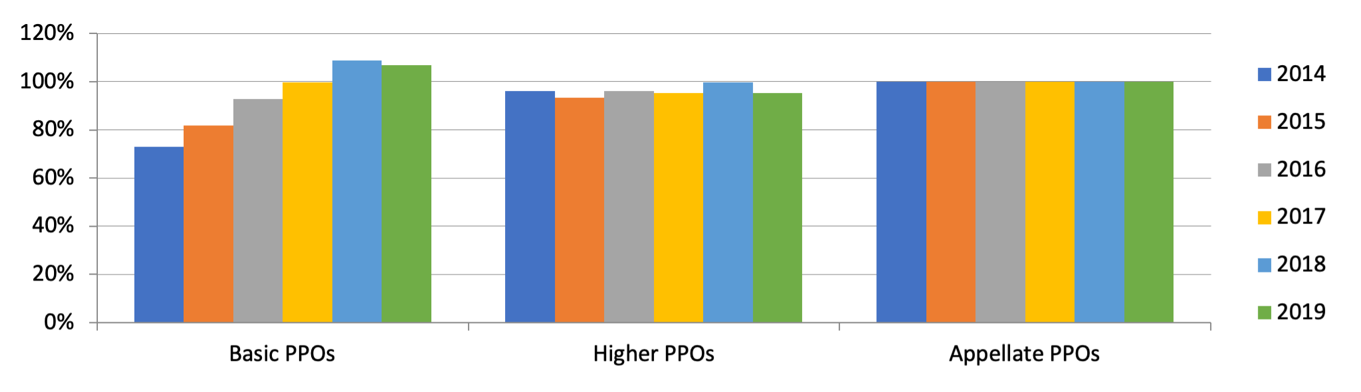
Source: WB Calculations
- As a group, Basic PPOs improved their average clearance
rates each year for an overall improvement of 34 percentage points from
2014 to 2019. The standout years were 2014, with a clearance
rate of 73 percent, and 2019 with a clearance rate of 107 percent. The
Basic PPO achievements in 2019, when three-quarters of the 58 Basic PPOs
achieved 100 percent or higher clearance rates in 2019, were a
significant improvement from 2014, when only one-fifth of the Basic PPOs
produced had clearance rates of at least 100 percent. See Figure 67 and
Figure 68, below. The 14 Basic PPOs making up the 24 percent were Basic
PPOs that did not reach favorable clearance rates and were mostly small
PPOs; the one exception was the First Basic PPO in Belgrade, with its
clearance rate of 84 percent in 2019. The only Basic PPOs with less
favorable clearance rates that year were the Basic PPO in Petrovac on
Mlava (68 percent) and the Basic PPO in Prijepolje (78 percent). Despite
lower dispositions in 2020, due to even lower incoming caseloads, Basic
PPOs produced a clearance rate of 112 percent.
- The average clearance rates for Basic PPOs as a whole
improved despite remarkable variations among the clearance rates of
individual Basic PPOs, a phenomenon not examined in any official
analyses the FR team could locate. Only the Basic PPO in
Kursumlija achieved clearance rates of over 100 percent each year, but PPO size was no guarantee of
favorable clearance rates, as shown by the three Basic PPOs in Belgrade,
three of the four the largest PPOs in Serbia (the second largest being
Novi Sad). Belgrade’s First Basic PPO achieved a favorable clearance
rate only once from 2014 to 2019, at 138 percent in 2018. Belgrade’s Third Basic PPOs also
had only one year in which they resolved more than they received. In
contrast, clearance rates for the Second Basic PPO in Belgrade were
consistently above 100 percent from 2016 to 2019.
- Belgrade’s Basic PPO results probably were due at least
in part to their increased numbers of operatively active
prosecutors. From 2014 to 2019, the increase was 53 percent for
the First Basic PPO, 58 percent for the Second PPO, and 87 percent for
the Third.
Figure 67: Clearance Rates of Selected
Basic PPOs from 2014 to 2019
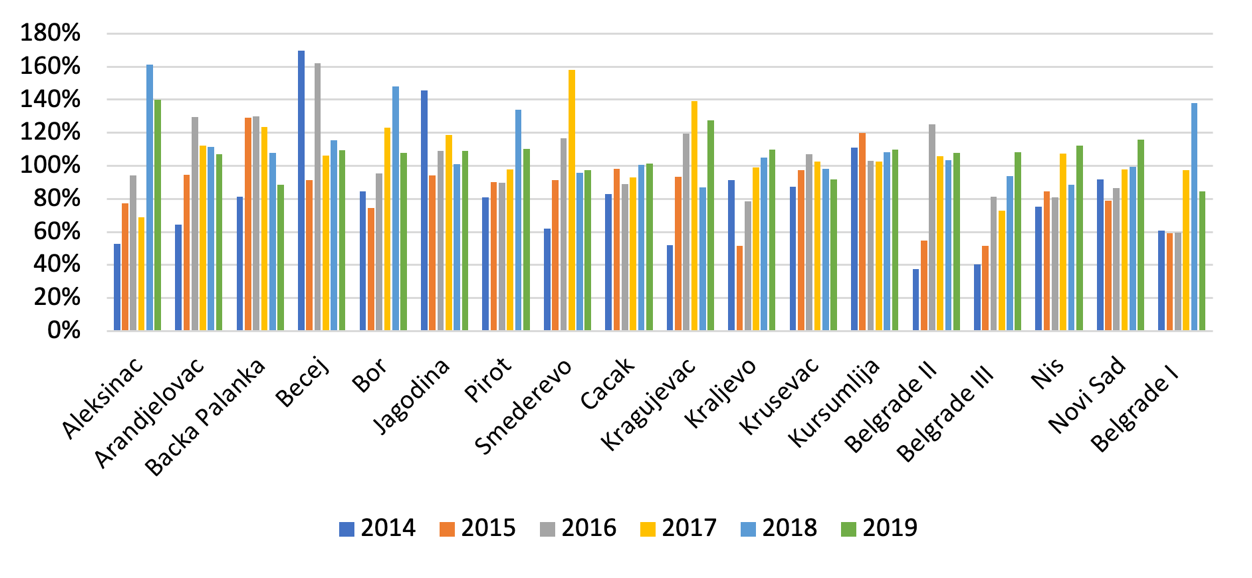
Source: RPPO Annual Reports 2014 – 2019 and WB
Calculations
- The overall average clearance rates for Higher PPOs
reached 100 percent only once in 2018 and otherwise ranged from 93
percent in 2015 to 96 percent in 2017. The rate for 2016 was 96
percent and the rate for 2019 was 95 percent. Although these figures
were relatively stable and relatively close to 100 percent, they show
that the pending stock consistently increased, as shown in Figure 68
below. Apart from the performance of the Higher PPO in Belgrade, there
were no other outliers among the Higher PPOs in Serbia. Another year in
which the overall average clearance rate for Higher PPOs reached the
favorable 101 percent was 2020, but as a direct consequence of the
significant drop in the Higher PPOs' incoming caseload.
- Twenty-three of Serbia’s 25 Higher PPOs achieved
clearance rates of at least 100 percent at least once between 2014 and
2019, the outliers being the Higher PPOs in Belgrade and
Zrenjanin. The rates for the Higher PPO in Zrenjanin ranged
from 94 to 99 percent, but the variations were much more marked for the
Higher PPO in Belgrade. That office had a rate of 95 percent in 2014,
only 79 percent in 2015, 87 percent in 2016, 90 percent in 2017, 97
percent in 2018, and 84 percent in 2019.
Figure 68: Clearance Rates of Higher PPOs from 2014 to 2019 per
Higher PPO
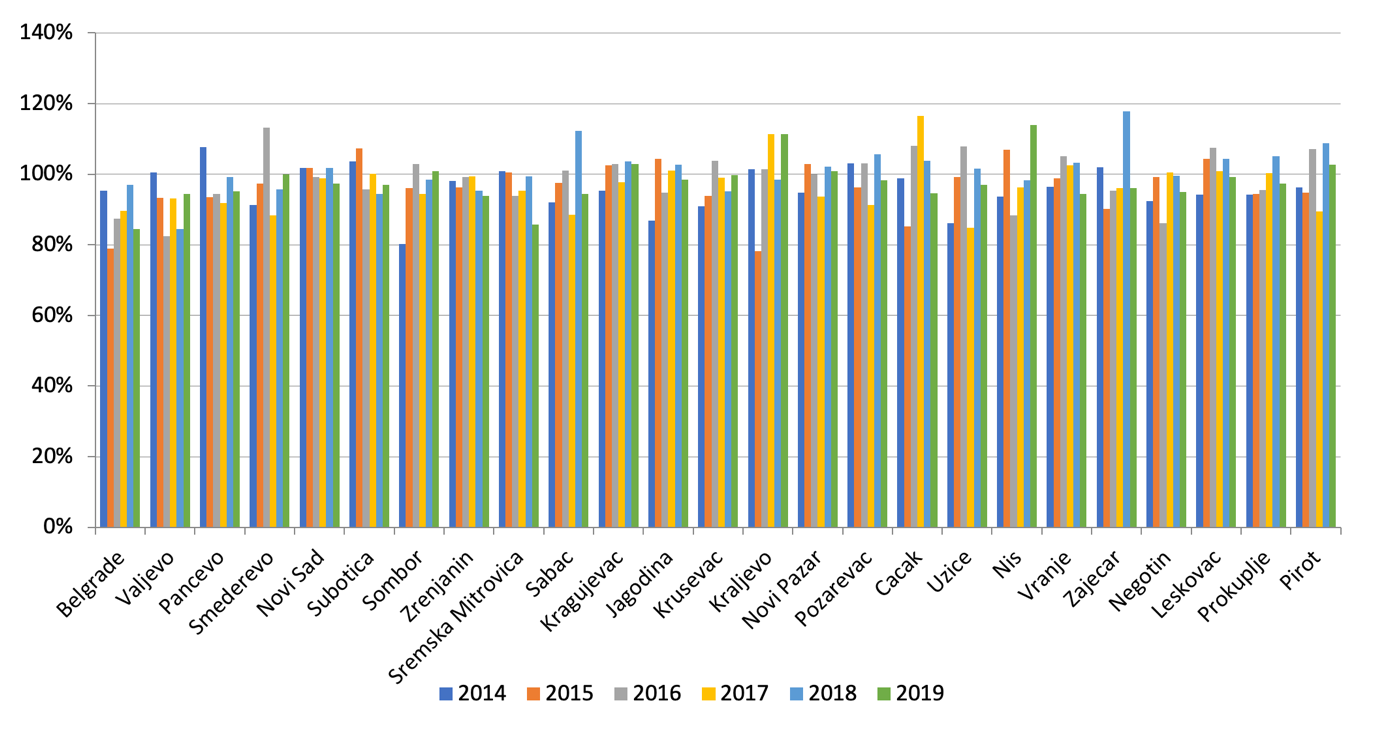
Source: RPPO Annual Reports 2014 – 2019
- The four Appellate PPOs each had clearance rates of 100
percent over the six years from 2014 through 2019. As the other
data reported in this FR show, Appellate PPOs were able to perform well
with their approved levels of funding and personnel.
Timeliness in Case
Processing ↩︎
- Even clearance rates exceeding 100 percent did not
guarantee the oldest and/or most complicated cases were concluded within
reasonable timeframes. As the Prosecutorial FR noted, the
pressure to resolve cases as quickly as possible often means older and
more difficult cases continue to age, in many if not all judicial
systems, a result that undercuts public confidence in prosecutors and
the courts.
- The available statistics for Serbian PPOs still did not
provide for average times to disposition or age structure of the pending
and resolved cases. As a result, timeliness is analyzed here
using three sets of indicators: the number of carried-over cases,
congestion ratios, and disposition times as defined by the
CEPEJ.
Number of Carried-Over Cases ↩︎
- In 2017, the total number of PPO cases carried forward
from one year to the next started decreasing after three years of
consistent increases. The increase from 2014 to 2017 was 27
percent, while in the following years, the pending stock declined by a
total of 19 percent and more than 25,000 cases, as shown by. Figure 69.
As expected given their share of the total number of cases in the
system, the carried-over cases in Basic PPOs influenced the totals the
most.
Figure 69: Carried-Over Cases in PPOs from 2014 to 2019
Source: RPPO Annual Reports 2014 – 2019
- The number of carried-over cases in Basic PPOs grew until
2016-2017, but the numbers for Higher PPOs grew persistently every year
between 2014 and 2019 for a total increase of 66 percent. The
pending stock of Basic PPOs declined by 11 percent in 2018 and 10
percent in 2019. The contrast between Basic and Higher PPOs is shown by
Figure 70 and Figure 71.
Figure 70: Carried-Over Cases in Basic PPOs from 2014 to 2019
Source: RPPO Annual Reports 2014 – 2019
Figure 71:Carried-Over Cases in Higher PPOs from 2014 to 2019
Source: RPPO Annual Reports 2014 – 2019
- These totals would be very different if ‘unknown
perpetrators cases,’ also known as KTN cases, were included. At the beginning of 2019, there
were 472,802 KTN cases pending in Serbian PPOs, of which 92 percent were
in Basic PPOs. The clearance rates for KTN cases in Basic PPOs was 64
percent in 2014, 48 percent in 2015, 79 percent in 2016, 128 percent in
2017, 93 percent in 2018, and 146 percent in 2019. Higher PPOs achieved
a clearance rate of 32 percent for KTN cases in 2014, 119 percent in
2015, 159 percent in 2016, 687 percent in 2017, 151 percent in 2018, and
100 percent in 2019.
- As noted in the discussion of clearance rates, from 2014
through 2019, Appellate PPOs had very few carried-over cases.
The Appellate PPOs in Kragujevac and Novi Sad resolved all of their
cases each year from 2014 to 2019, while the Appellate PPO in Nis
carried over six to 17 cases each year. The Appellate PPO in Belgrade
carried over 50 cases in 2018 and three cases in 2019. For both Nis and
Belgrade PPOs, the number of cases carried forward was negligible,
representing at most one percent of their workloads.
Congestion Ratios ↩︎
- Congestion ratios are calculated by dividing the total
number of unresolved cases at the end of one year by the number of
resolved cases during that same year. This ratio should
indicate what effect the number of carried-over cases had on PPO
performance. While there is no standard goal for prosecutorial
congestion ratios, larger numbers indicate higher congestion levels and
probable delays. A congestion ratio should be under 1.00 and ideally
under 0.50, to ensure there are far fewer unresolved cases at the end of
the year than the number of cases resolved during the year.
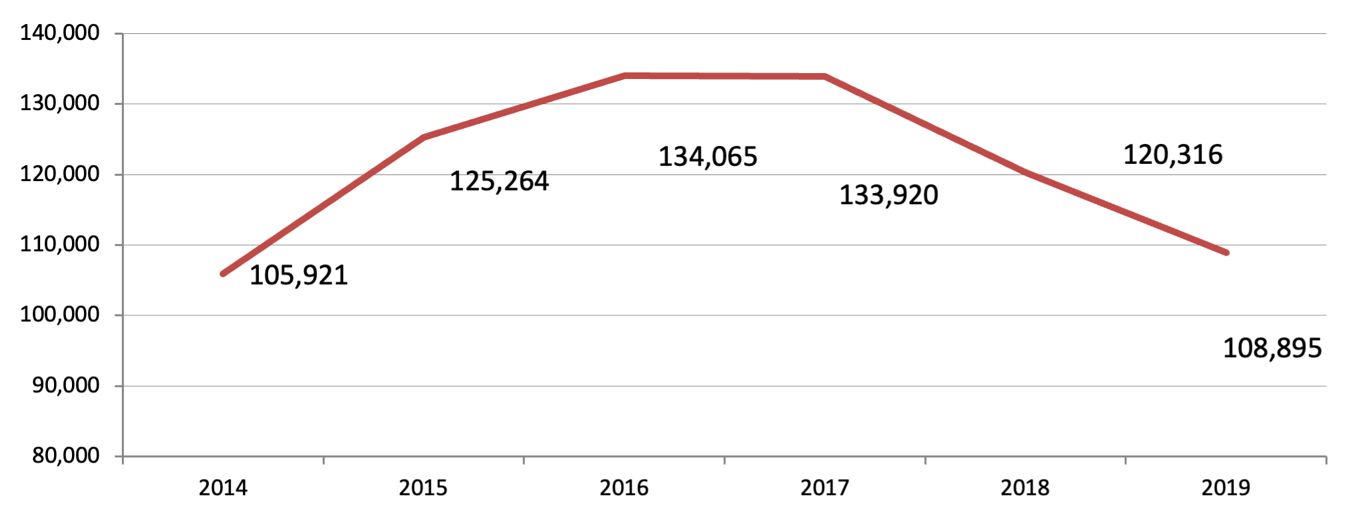
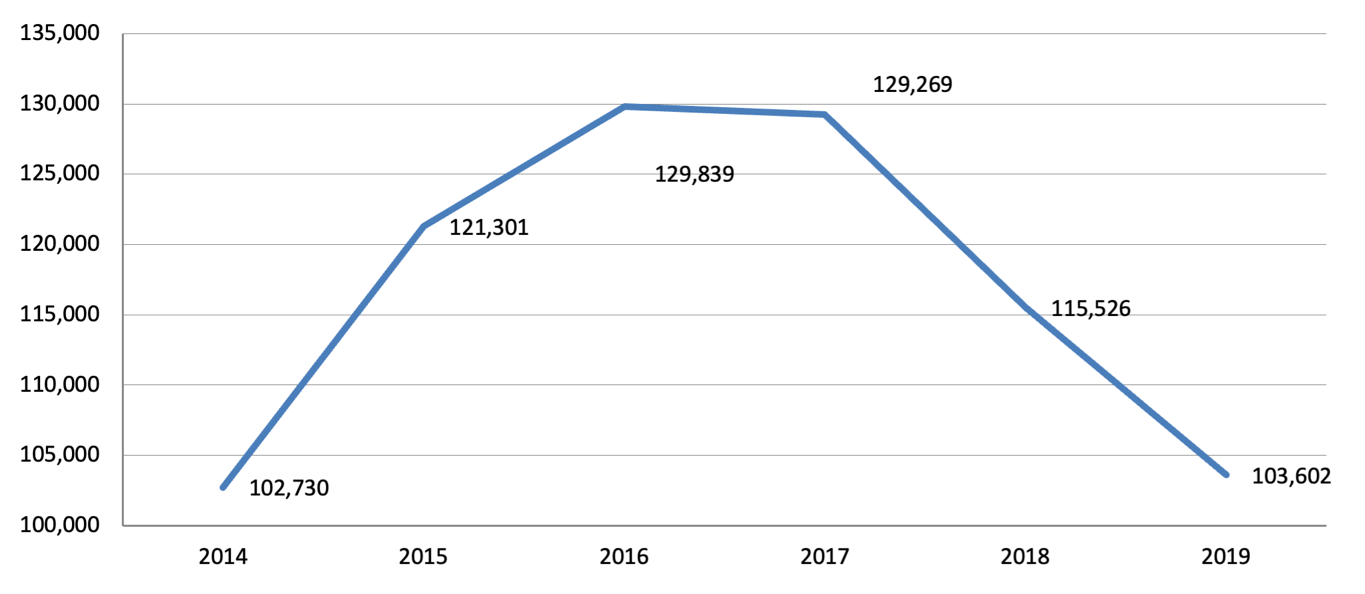
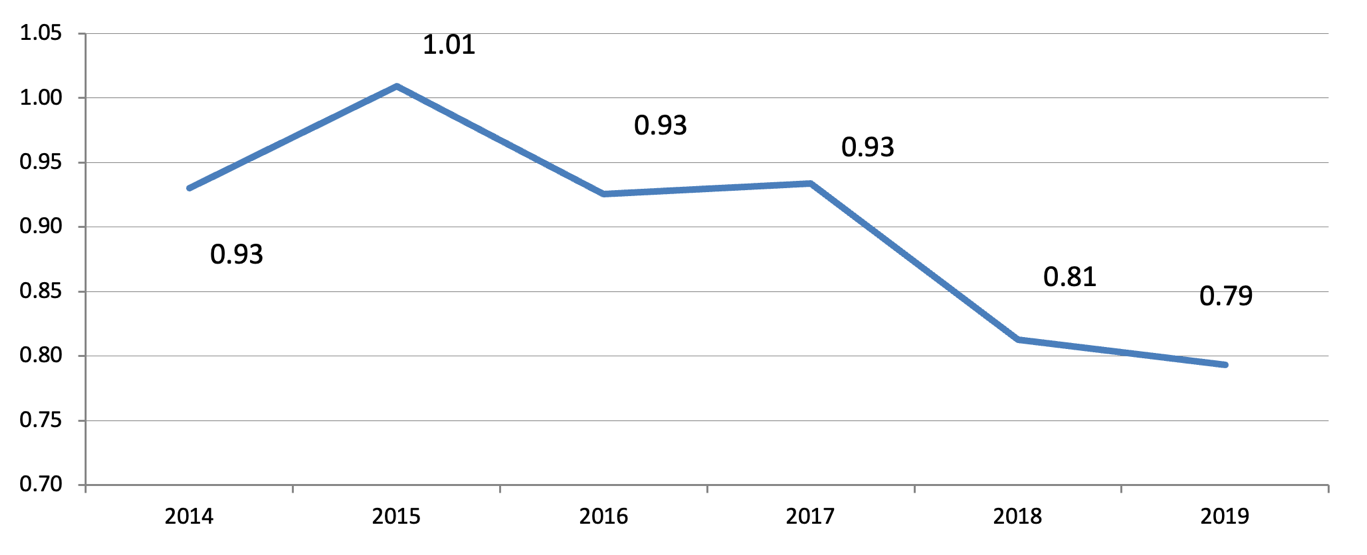
- Serbia’s overall prosecutorial congestion ratios from
2014 to 2019 ranged from 0.79 to 1.01, as shown in Figure 72 below, with
the most recent ratios leaving room for progress. The
congestion ratio in 2018 was 0.81, with 120,316 unresolved and 148,087
resolved cases at the end of the year. For 2019, the ratio was 0.79
based on 108,895 unresolved cases and 137,287 resolved cases.
Figure 72: Overall Congestion Ratios of Basic, Higher and Appellate
PPOs from 2014 to 2019
Source: WB Calculations
- Although they were improving, Basic PPOs continued to
have the highest congestion ratios among the three PPO categories, with
results two to six times higher than those of Higher PPOs.
There was no congestion in Appellate PPOs, as shown by Figure
73.
Figure 73: Congestion Ratios per PPO Type from 2014 to 2019
Source: WB 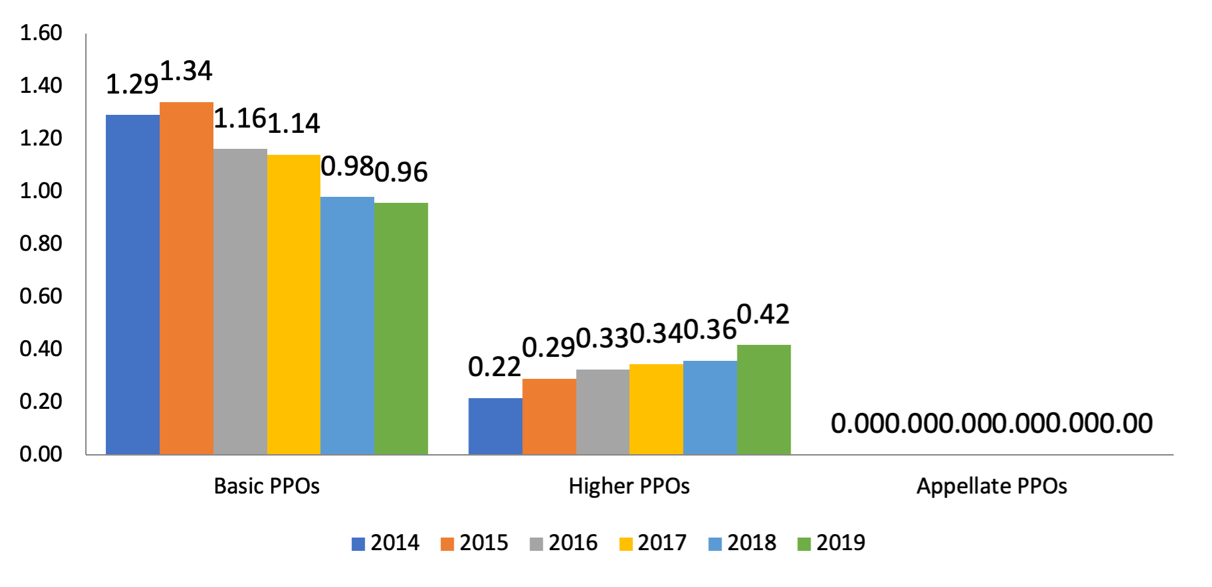 Calculations
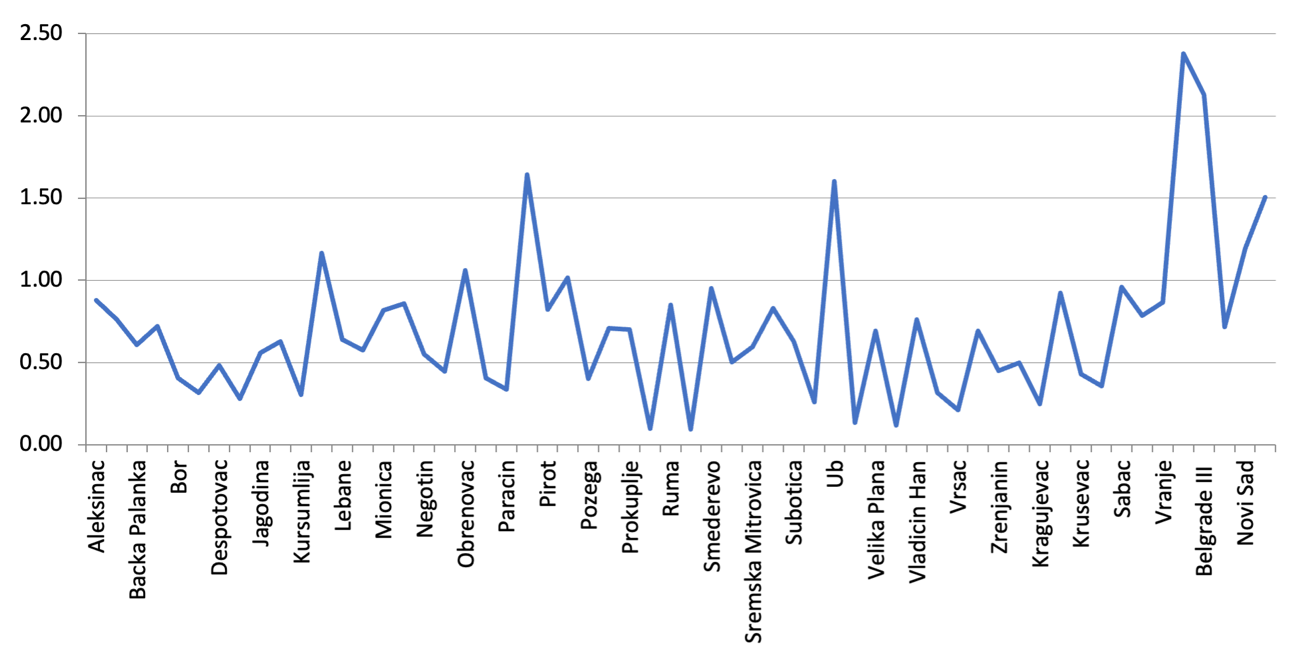
- Congestion ratios for individual Basic PPOs in 2019
continued to vary widely as shown in Figure 74 below, with nine of them
exceeding 1.00. The highest congestion ratios were recorded in
the Second and the Third Basic PPOs in Belgrade, at 2.38 and 2.13,
respectively. The PPO of Petrovac on Mlava followed with 1.64. In
addition to the Second and Third Basic PPOs in Belgrade and the office
in Petrovac on Mlava, the Basic PPOs with ratios exceeding 1.00 included
the Basic PPOs in Ub (1.60), Belgrade’s First (1.51), Novi Sad (1.19),
Lazarevac (1.16), Obrenovac (1.06), and Pozarevac (1.02). Nevertheless,
22 of the 58 Basic PPOs, or 38 percent, reported ratios equal to or
lower than 0.50 in 2019, showing that more efficient performance is
possible, at least in small and medium PPOs. For example, the Basic PPO
in Kragujevac had a congestion ratio of 0.25, the Basic PPO in Leskovac
0.36, and the Basic PPO in Senta 0.09.
Figure 74: Congestion Ratios of Selected
Basic PPOs in 2019
Source: WB Calculations
- The overall congestion ratios in Higher PPOs remained
under 0.50 every year from 2014 to 2019, although they increased
slightly each year. The overall ratios stayed within the
desired range of less than 0.50, although they almost doubled from 2014
to 2019 due to extraordinarily high congestion in Belgrade’s Higher PPO.
The ratio for Belgrade congestion deteriorated greatly after 2014, when
it was 0.34 even though the number of prosecutors for that office
increased from 43 in 2014 to 64 by 2019; the ratio was 0.73 in 2015,
1.00 in 2016, 0.96 in 2017, 1.12 in 2018, and 1.43 in 2019. In 2019, the
highest congestion ratio after Belgrade was reported in Sremska
Mitrovica, at 0.46. The greatest contrast to Belgrade and Sremska
Mitrovica was found in Leskovac, where the congestion decreased from
0.20 in 2014 to 0.02 in 2018 and 2019
Time to Disposition ↩︎
- Since Serbian PPOs still were not tracking the duration
of individual cases after the analyses done for the Prosecutorial FR,
this review continues to use the CEPEJ methodology for the calculation
of the theoretical time necessary for a pending case to be disposed of,
taking into consideration the then-current pace of work of
PPOs. The indicator is reached by dividing the number of
pending cases at the end of a particular period by the number of
resolved cases within that period, multiplied by 365 days. The resulting indicator is not an
estimate of the average time needed to process a case but a theoretical
average of the duration of a case within a specific system (e.g., by
individual PPO, types of PPOs, PPOs by region, or PPOs by
country).
- Disposition times of Serbian prosecutors decreased
gradually from 2014 to 2019, although they continued to be two to six
times higher in Basic than in Higher PPOs. Disposition times of
Higher PPOs are expectedly lower than in Basic PPOs as their cases are
mostly urgent since the defendants are in custody and their jurisdiction
is narrower. The overall disposition time for the system decreased from
339 days in 2014 to 290 days in 2019. The decrease in Basic PPOs was
from 471 to 349 days. The Third Basic PPO in Belgrade struggled the most
in terms of disposition time and was the only Basic PPO that exceeded
one thousand days for five years in a row from 2014 to 2018. Its
disposition almost halved from 2014 (1,374 days) to 2019 (777 days). The
Basic PPOs with the best disposition times in 2019 were those in Senta
(34 days), Raska (36 days), and Veliko Gradiste (42 days). Moreover,
Veliko Gradiste’s calculated disposition time of 20 days in 2018 was a
91 percent improvement over 2014. See Figure 75.
Figure 75: Disposition Times of Selected
Basic PPOs from 2014 to 2019
Source: WB Calculation
- The Higher PPO in Belgrade was responsible for the
consistently increasing average disposition times for Higher PPOs
overall, times that almost doubled from 2014 (79 days) to 2019 (152
days). There was no official analysis available to the FR team
to explain the cause of the increase for Belgrade. While most other PPOs
managed to keep their disposition times under 100 days,
for Belgrade, the disposition time of 124 days in 2014 quadrupled to 523
days in 2019. The Higher PPO in Belgrade had a 25 percent drop in the
number of resolved cases from 2014 to 2019, its clearance rate decreased
from 95 to 84 percent, and its carried-over stock increased from 1,174
cases in 2014 to 3,685 in 2019. See Figure 76 below.
Figure 76: Disposition Times of Higher PPOs from 2014 to 2019
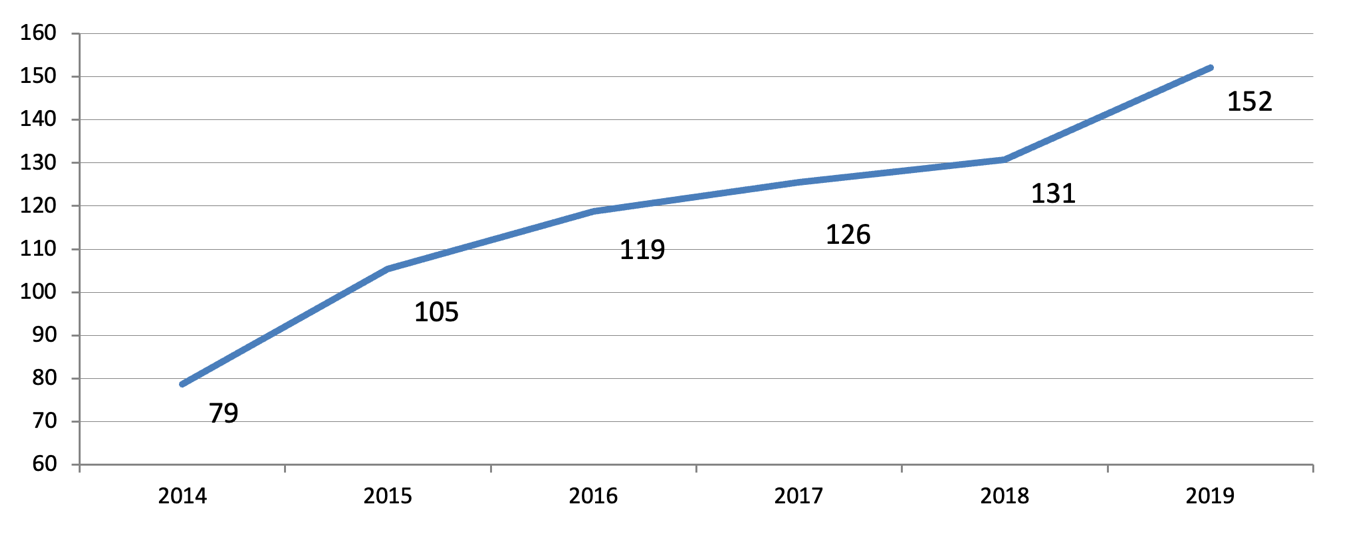
Source: WB Calculation
- As with other efficiency indicators, disposition times of
Appellate PPOs were excellent from 2014 to 2019, since these PPOs
essentially resolved all of their incoming cases each
year.
Efficiency per Prosecutor ↩︎
- According to the CEPEJ 2020 report (2018 data), the
number of Public Prosecutors per 100 thousand inhabitants in Serbia was
11.2, which was an increase of 2.4 prosecutors over the previous CEPEJ
report that examined 2016 data, and in line with the EU27
average. The EU11 average for 2018 was 16.7, and the Western
Balkans average was 12.52. When compared to individual regional peers
from the EU11 and Western Balkans, only Bosnia and Herzegovina had a
similar ratio of 10.7. See Figure 77 below.
Figure 77: Number of Public Prosecutors per 100,000 Inhabitants –
CEPEJ 2020 Report
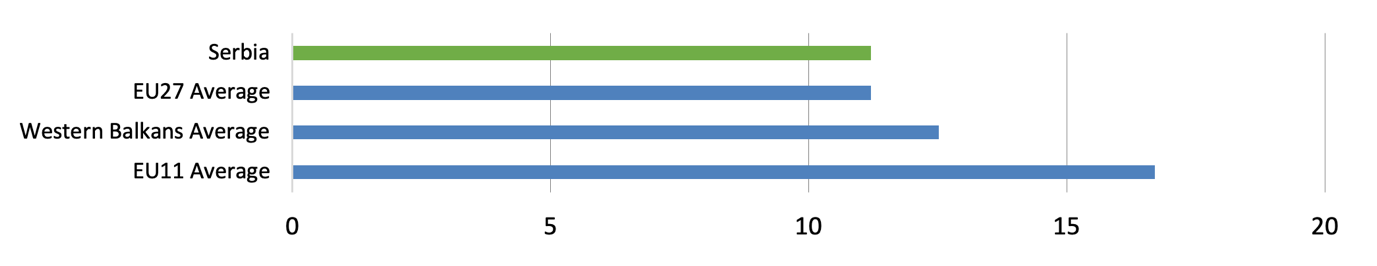
Source: CEPEJ Report 2020 (2018 data)
Caseloads per Prosecutor
- The caseloads – meaning incoming cases -- for prosecutors
within all PPO types decreased from 2014 to 2019. Caseloads per
prosecutor decreased by 25 percent in Basic PPOs, by 33 percent in
Higher PPOs, and by 18 percent in Appellate PPOs, as presented in Figure
78 below.
Figure 78: Caseload per Prosecutor in Basic, Higher and Appellate PPOs from 2014 to 2019

Source: WB Calculations
- After three years of increases, the number of incoming
cases in Basic PPOs started dropping in 2017, as the number of
prosecutors working on cases increased by almost one quarter from 2014
to 2019. In Higher PPOs, the number of incoming cases varied
between 13,000 and 15,000 thousand, while the number of prosecutors grew
by 30 percent, causing the caseload per prosecutor to drop. However, the
increase in the number of Higher PPOs prosecutors primarily was
connected to the establishment of the four specialized anti-corruption
departments. These prosecutors could not be excluded from the total for
this calculation since it could not be determined how many of the
prosecutors in the four PPOs were working in the anti-corruption
departments versus other departments. See Table 13 below.
Table 13: Caseload and Prosecutors in Basic and Higher PPOs from 2014
to 2019
| Basic PPOs |
Caseload |
108,922 |
110,532 |
120,424 |
113,620 |
108,479 |
101,312 |
| Prosecutors |
355 |
344 |
350 |
350 |
429 |
439 |
| Higher PPOs |
Caseload |
15,319 |
14,639 |
13,451 |
14,162 |
13,263 |
13,316 |
| Prosecutors |
158 |
157 |
161 |
167 |
186 |
206 |
Source: RPPO Annual Reports 2014 – 2019
- By 2019, each prosecutor in Basic PPOs had an average of
231 incoming cases, but the substantial caseload differences among
prosecutors in Basic PPOs described in the Prosecutorial FR
persisted. Prosecutors in Higher PPOs generally had lower
numbers of incoming cases in 2019, ranging from a low of 23 cases in
Kraljevo to a high of 194 cases in Zrenjanin. Of the 25 Higher PPOs, in
17 (68 percent) prosecutors had caseloads below the national
average.
- Caseload per prosecutor decreased in Appellate PPOs to
248 cases in 2019. While Appellate PPOs in Belgrade and
Kragujevac reported a drop in incoming cases over the past two years,
the number of these cases were up in Nis and Novi Sad.
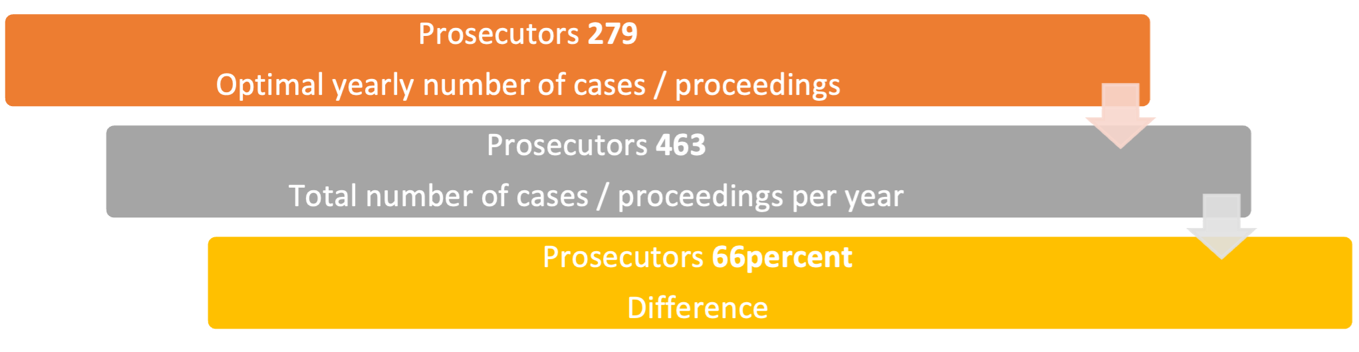
- Although the number of prosecutors has increased over the
last few years, the prosecutors evaluated that their annual caseload
considerably exceeds the optimal one. The difference between
the actual caseload and the caseload that prosecutors perceive as
optimal is significant. According to prosecutors, the actual caseload
exceeded the optimal one by 66percent on average. The perceived range of
actual and optimal caseload varies among different types of courts and
prosecutor offices. Prosecutors from basic prosecutor offices cite a
higher number of cases they usually work on.
Dispositions per Prosecutor
- Across all PPO types, average dispositions per prosecutor
were very similar to the trends for caseloads per prosecutor.
From 2014 to 2019, there was an increase of 10 percent for average
dispositions per prosecutor in Basic PPOs, and decreases in Higher and
Appellate PPOs by 29 and 17 percent, respectively. See Figure 79
below.
Figure 79: Dispositions per Prosecutor in Basic, Higher and
Appellate PPOs from 2014 to 2019
Source: WB Calculations
- Dispositions per prosecutor in Basic PPOs grew each year
from 2014 to 2016 and then declined from 2017 to 2019, with stable or
increasing dispositions per prosecutor for most, but not all, Basic PPOs
from 2014 to 2019. Some PPOs, like the three Basic PPOs in
Belgrade, increased their numbers of prosecutors while others lost
prosecutors (e.g., the Basic PPOs in Leskovac, Pancevo, and Sabac). On
the other hand, the Basic PPO in Novi Sad added four prosecutors in 2019
compared to 2014, its caseload of incoming cases decreased by six
percent, and the number of disposed of cases per prosecutor fell by 18
percent.
- Average dispositions per prosecutor in Basic PPOs varied
more than the caseloads per prosecutor by a factor of four.
They ranged from 131 in Prijepolje to 562 in Kursumlija. More than
one-half or 31 of the Basic PPOs achieved lower-than-average
dispositions per prosecutor. In eight Basic PPOs, dispositions per
prosecutor were average, and in one-third or 19 Basic PPOs, the
depositions per prosecutor were above average.
- However, as was true for caseloads, disposition numbers
per prosecutor in Basic PPOs still did not correlate to PPO
size. Small PPOs reached some of the highest disposition rates
per prosecutor, and PPOs with consistently above-average disposition
rates were all small in size, with six or fewer prosecutors.
- The decreasing disposition rates per prosecutor in Higher
PPOs indicated that at least some of the Higher PPOs were receiving the
additional staff they needed. Disposition rates for Higher PPOs
overall were half those of Basic PPOs and Appellate PPOs, and reduced
consistently over time. However, based on interviews conducted by the FR
team, the decreased disposition times probably were due to the increased
number of Higher PPO prosecutors assigned to specialized
departments.
- Appellate PPO prosecutors managed to dispose of the same
number of cases they received.
Efficiency
of Specialized PPOs and Specialized PPOs Departments in Higher PPOs ↩︎
- With the notable exception of the PPO for Organized
Crime, Specialized PPOs and PPOs’ specialized departments in Serbia were
burdened by performance issues, unstable and low clearance rates, high
congestion rates, and high disposition times.
- Based on all the efficiency indicators discussed in this
Chapter, procedures used by the PPO for Organized Crime to achieve its
results from 2014 to 2019 should be adopted by other PPOs as often as
possible. The organized crime PPO’s relatively low caseload of
474 cases in 2019 was almost double its caseload for 2014 when 238 cases
were received, but the office still moved its cases through the system
well. The clearance rate reached 102 percent in 2014 and stood at 99
percent in 2015, 92 percent in 2016, 97 percent in 2017, 95 percent in
2018, and 98 percent in 2019. Disposition times varied from 50 days in
2017 to 111 days in 2016; in 2019, the time was 89 days. The congestion
rates were in the ideal category, below 0.50 from 2014 to 2019.
- Conversely, results for the PPO for War Crimes varied
significantly from a clearance rate of 380 percent in 2015 to 25 percent
in 2017. In 2018 and 2019, its clearance rate stabilized at 107
and 100 percent, respectively. Congestion rates followed the erratic
variations, but the congestion was regularly well over 1.00; in 2019, it
was 1.58. Only in 2015 did this value drop to a satisfactory 0.37.
Similarly, disposition times were high, 967 in 2014, 134 in 2015, 557 in
2016, 1,590 in 2017, 706 in 2018, and 576 in 2019. However, all these
variations relate to very small workloads; 20 cases were received in
2014, 10 in 2015, 34 in 2016, 56 in 2017, 29 in 2018, and 28 in
2019
- The Special Prosecution Office for High Tech Crime within
the Belgrade Higher PPO more than quadrupled its pending stock/workload
from 226 cases in 2015 to 952 cases in 2019, primarily due to low
clearance rates. Its clearance rate
was 68 percent in 2015, 42 percent in 2016, 67 percent in 2017, 58
percent in 2018, and 67 percent in 2019. Low clearance rates (68 percent
in 2015, 42 percent in 2016, 67 percent in 2017, 58 percent in 2018, and
67 percent in 2019) were accompanied by high congestion ratios and high
disposition times. The congestion ratio jumped from 1.47 in 2015 to 4.96
in 2019, while the disposition times ranged from a low of 536 days in
2015 to a high of 1810 days in 2019. Although this could not be verified
from the available data, the high congestion rates, high disposition
times and low clearance rates well may have been due to the complex
nature of many of the cases. The caseload for 2014 was illegible in that
Annual Report; in 2015, the caseload was 226, 322 in 2016, 252 in 2017,
324 in 2018, and 287 in 2019.
- The specialized departments to combat corruption,
established in 2018 in four Higher PPOs received 9,682 criminal
complaints in their first year of operation, most of which had been
started by Higher PPOs before 2018. The transfer of these cases
from other Higher PPOs probably enhanced the workloads and disposition
numbers of the original PPO. In total, 3,696 criminal complaints were
resolved in 2018, of which 75 percent were dismissed. Also, during 2018,
465 days were needed to resolve a criminal complaint, while the
clearance rate was only 44 percent. In 2019, the departments disposed of
5,146 more cases and raised their overall clearance rate to 78 percent.
However, due to the increased workload, the average disposition time
increased to 545 days.
Efficiency Perceived by
Stakeholders ↩︎
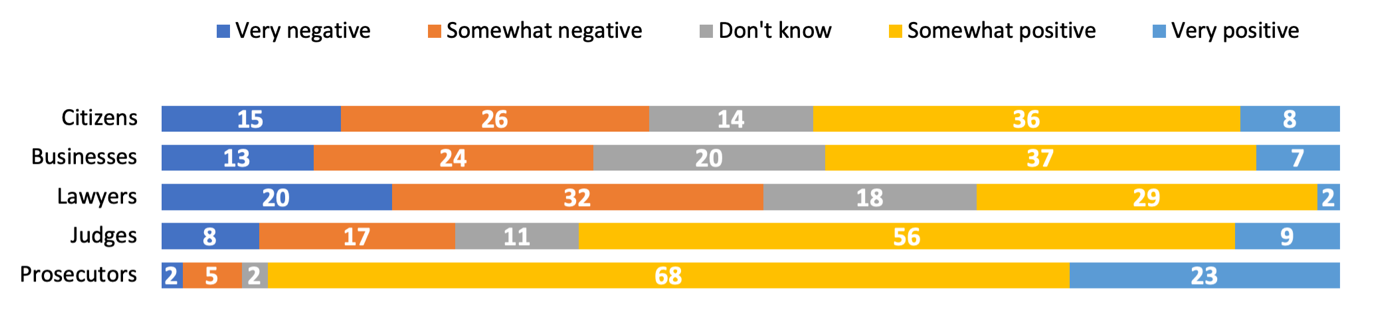
- According to the Regional Justice Survey, the highest
level of satisfaction with the efficiency of public prosecutors is
present among prosecutors themselves and judges, while lawyers are the
least satisfied. Court service users stand somewhere in
between. Nine out of ten prosecutors believe that their institution
efficiently performs designated tasks (91percent). Judges predominantly
agree with them, with two-thirds of those satisfied with the public
prosecution’s efficiency (65percent). The general public and businesses
have very similar views – 44percent of both populations positively
evaluate prosecution’s efficiency.
Figure 80: CITIZENS, BUSINESSES, LAWYERS, JUDGES AND PROSECUTORS:
GENERAL PERCEPTION OF PROSECUTION EFFICIENCY
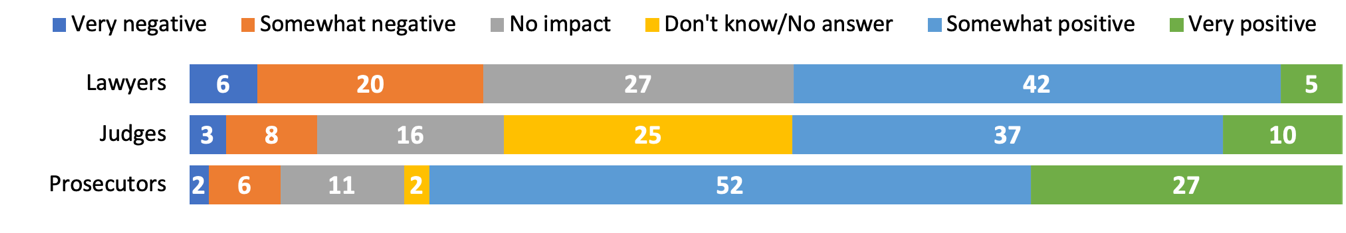
- Cooperation with other investigative bodies is recognized
by public prosecutors as the most important element that contributes to
the efficiency of prosecution service. As many as 79 percent of
prosecutors point out a positive impact of that collaboration, 11
percent do not consider it has any impact, while only 8 percent assess
it as negative. Judges and lawyers do not perceive cooperation between
prosecutors and other investigative bodies as relevant for the
efficiency of prosecution service.
Figure 81:LAWYERS, JUDGES AND PROSECUTORS: IMPACT OF COOPERATION
BETWEEN PUBLIC PROSECUTION AND OTHER INVESTIGATIVE BODIES
- Experience with prosecution makes citizens’ perception of
their efficiency more negative. 44 percent of citizens without
experience with public prosecutors have a positive opinion of their
efficiency, while only 37 percent of those with experience have the same
opinion. Unlike citizens, business representatives with personal
experience have at least a somewhat more positive view of the efficiency
of all public prosecutors.
- The majority of public prosecutors agreed that measures
for improving of efficiency of their work are increased the number of
prosecutors, investigators, and other staff, but also improvement of
infrastructure and cooperation with investigative bodies.
Prosecutors are almost completely uniform in the opinion that a larger
number of employees in the prosecution’s administration would primarily
lead to the higher efficiency of their office (97percent). Most of them
also underline an increase in the number of prosecutors themselves
(88percent), improved infrastructure (86percent) and better cooperation
with Police (84percent).
Impact
of the Covid-19 Pandemic on PPOs Efficiency in 2020 ↩︎
- The preliminary assessment of the impact of the pandemic
on the efficiency of PPOs indicates that there were no immediate effects
on Serbian PPOs, however, such impacts undoubtedly did occur and will
reveal themselves in the upcoming years. The declared state of
emergency from mid-March to mid-May 2020 halted prosecution proceedings
that were not deemed urgent and caused caseloads
and dispositions to decline. The overall clearance rates in 2020
remained favorable primarily due to the falling number of incoming
cases.
- The pandemic also forced changes in some of the
prosecutors’ work processes which may have affected both the quality and
efficiency of their work. For instance, some hearings had to be
held online, such as for violation of self-isolation measures. As of
December 2021, it was still hard to predict the extent of additional
congestion that would arise after the pandemic ends (or at least is
under greater control). They may be many proceedings ‘stuck’ in the
system in the meanwhile, and some new cases may appear as a direct
influence of the pandemic.
Recommendations and Next
Steps ↩︎
Recommendation 1: Improve and extend prosecutors’ use of
automatic CMS.
Automatic CMS for PPOs should be fully developed and rolled out,
including a detailed, flexible reporting module.
The new CMS (SAPO II) should allow the generation and use of these
recommended features:
- Perform gap analysis to identify which data, reports, alerts, and
searches will be needed for sole reliance on the CMS. (SPC, RPPO –
short-term)
- Specify which reports should be automatically and regularly
produced by CMS, aligned with internal and external reporting needs.
(SPC, RPPO – short-term)
- Specify which alerting mechanisms in the CMS would facilitate
case processing and enable prosecutors to manage their workload more
efficiently. (SPC, RPPO – short-term)
- Amend bylaws and rules accordingly. (SPC, RPPO –
medium-term)
- Migrate all existing data to the system. When necessary, enter
legacy data manually through simplified forms. Transfer all relevant
hard copy data to the digital system. (MOJ, RPPO, SPC, and PPOs –
medium-term)
- Eliminate paper registries in PPOs. (SPC, RPPO –
long-term)
Recommendation 2: Establish specialized investigation
departments.
The specialized investigation department established in the First
Basic PPO in Belgrade has been beneficial, and its implementation in
other Basic PPOs and in Higher PPOs is worth exploring.
- Conduct a study in the First Basic PPO in Belgrade to determine
what aspects of that department should be established in other Basic and
Higher PPOs, for what case types, and the resources necessary to do so.
(RPPO, SPC – short-term)
- Provide the necessary resources for the new departments to
operate. (SPC, RPPO, MOJ – medium-term)
Recommendation 3: Improve monitoring of caseloads and
performance.
Regularly monitor prosecutors’ tasks to assess their caseload and
performance. This addresses prosecutors’ concerns that their work on
cases that significantly increase their workload is not adequately taken
into account during the distribution of cases and their performance
assessments.
- Identify these tasks and analyze their impact on the performance
of PPOs. (SPC, RPPO – short- term)
- Unify data entry and tracking of ‘KTR’ cases among PPOs and avoid
double-registering cases (RPPO
- – short-term)
- Quantify how much work prosecutors are investing in ‘KTR’ cases.
(SPC, RPPO – short-term)
- Consider using CMS for the classification of ‘KTR’ cases in order
to evaluate their impact on performance. (RPPO, SPC –
medium-term)
- Enter and manage data on ‘KTR’ cases in a way that will continue
to identify them once a prosecutor has begun a formal investigation of
the matter and moved the case to a different registry. (RPPO, SPC –
medium-term)
- Track time to disposition in all case types. (RPPO, SPC –
medium-term)
Recommendation 4: Improve processing of cases about unknown
perpetrators.
- Regularly archive ‘KTN’ cases so they do not burden the system
once their statutes of limitation expire. (RPPO – medium-term)
Recommendation 5: Develop a backlog reduction plan to reduce
the significant number of carried-over cases, particularly cases that
have been pending for over two years.
The judiciary should be included in most if not all of the following
as needed. However, there may be policies or programs that prosecutors
can pursue internally to monitor the timeliness and reduce backlogs in
PPOs.
- Establish a permanent working group to draft and monitor the
implementation of the backlog reduction plan. Membership of the group
may change over time, but its function should not since backlogs are a
permanent threat to the efficiency and quality of all prosecutorial
systems. (RPPO – short-term)
- Develop and update a list of aging cases being handled by each
PPO. The lists would contribute to the detailed design of a CMS and
backlog reduction plans for all PPOs. These lists should be updated at
least every six months. (RPPO short-term) Publicize results. (RPPO –
medium-term)
Recommendation 6: Identify, disseminate, and incentivize
sharing of good practices.
Conduct a detailed study of the investigation, case handling,
management, and administrative practices of the most efficient PPOs in
each size category. The study would identify processes or policies that
could help other PPOs improve their case disposition times and numbers
and reduce the age and number of cases carried over from one year to the
next.
- Prepare a report detailing the most efficient practices and the
preconditions for putting them into practice in other PPOs. (RPPO, SPC –
short-term)
- Prepare relevant Rules and ‘bench books’ to record the steps
necessary to implement the recommended practices. (SPC, RPPO –
short-term)
- Roll out efficient practices to lower-performing PPOs through
peer exchange programs, workshops, JA training, etc. (SPC, RPPO, JA –
medium-term)
- Develop incentives for the highest performing and most improved
prosecution offices. This could be modeled on the existing award program
for the best-performing courts. (RPPO, SPC – medium- term)
Recommendation 7: Allocate prosecutorial resources based on
demand for services rather than population to equalize the number of
cases per prosecutor (RPPO, SPC – medium-term)